Dashboard
The Dashboard is the operator's first screen, and the host of the platform's activity views.
Dashboard
The Dashboard is the admin home page, providing a real-time overview of platform health across configurable time ranges (1h, 6h, 24h, 7d).
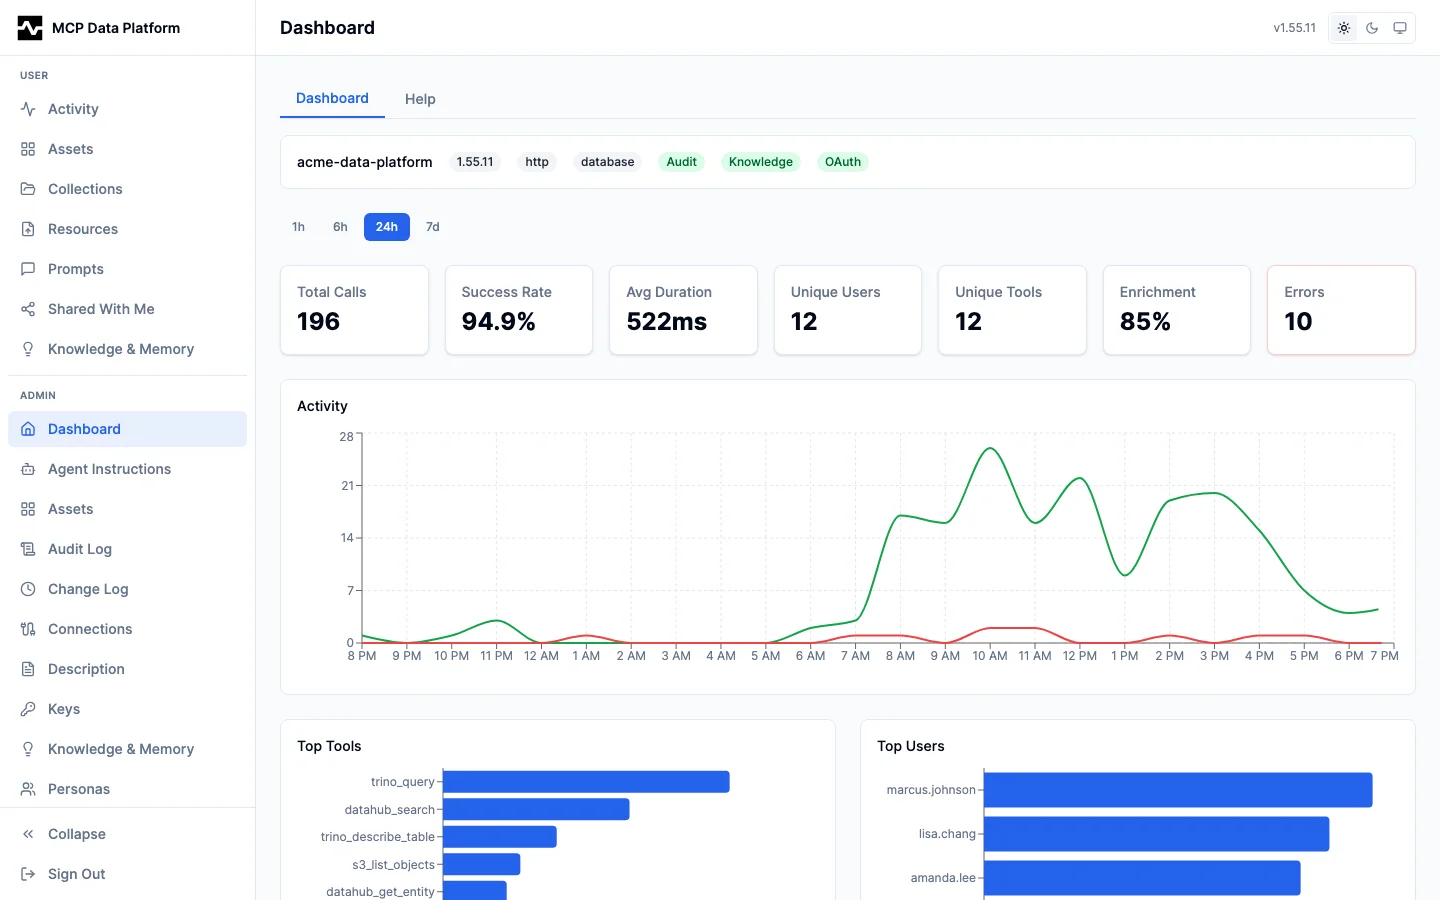
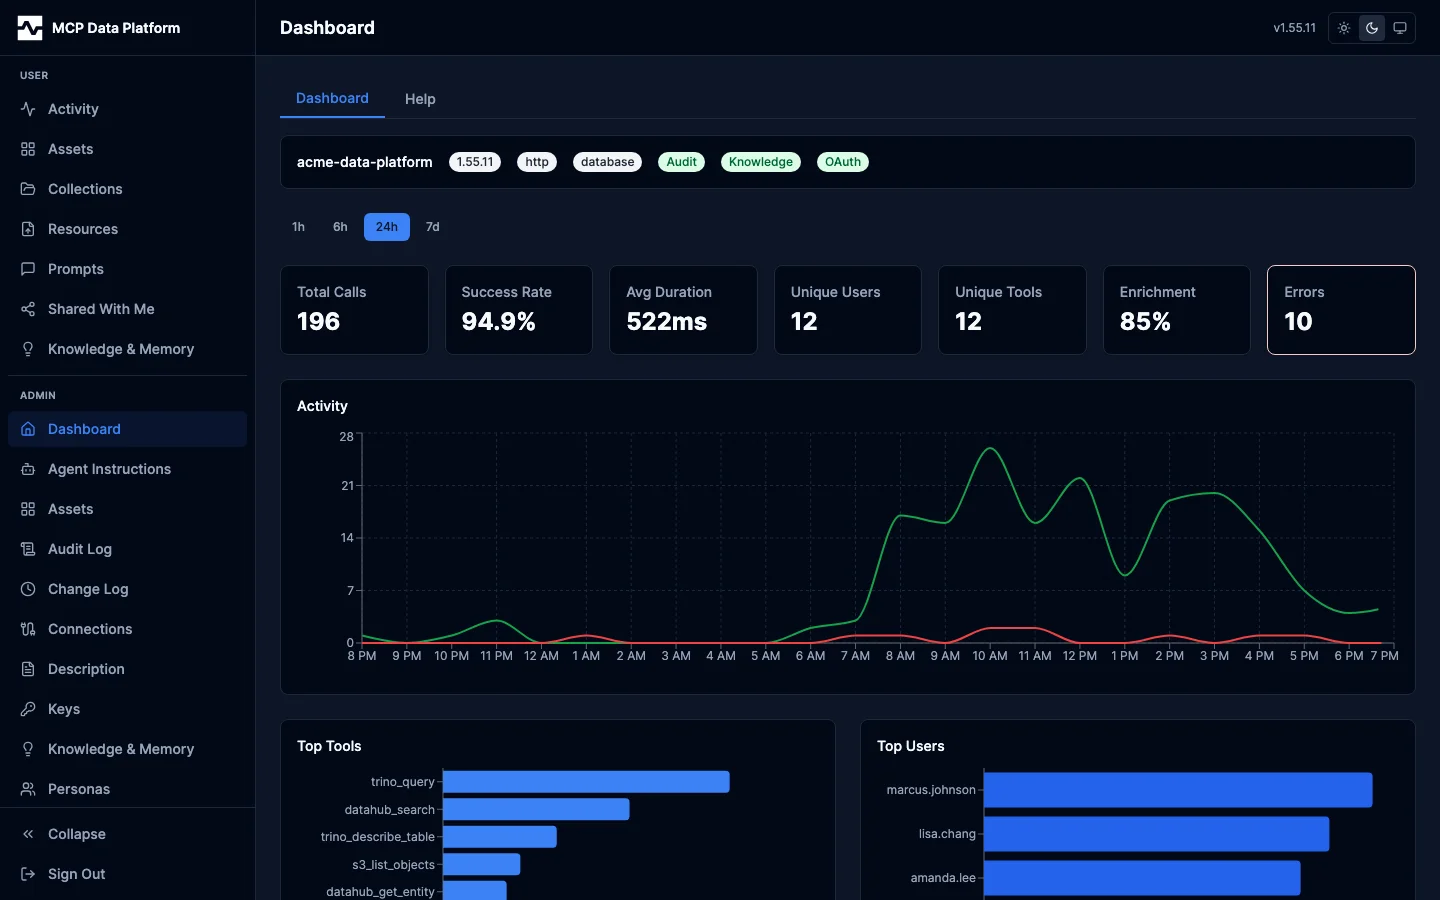
The dashboard includes:
- System info bar — Platform name, version, transport, config mode, and enabled features (Audit, Knowledge, OAuth)
- Summary cards — Total calls, success rate, average duration, unique users, unique tools, enrichment rate, and error count
- Activity timeline — Tool call volume over time (green) with error overlay (red)
- Top Tools / Top Users — Horizontal bar charts showing the most active tools and users
- Performance — Response time percentiles (P50, P95, P99) and average response size
- Recent Errors — Clickable error list with detail drawer
- Knowledge Insights — Summary statistics and category breakdown with pending review queue
- Connections — All configured toolkit connections with tool counts
Indexing
The Indexing tab of the Dashboard (alongside MCP, API Gateway, Health, and Events) is an admin-only, cross-kind view of embedding-index health for every consumer of the shared index_jobs queue (pkg/indexjobs): api-catalog operation vectors, tool descriptors, and any future consumer, which gets visibility here for free the moment it registers. Embedding work runs off the request path, so a provider outage, a model dimension mismatch, or repeated retries can silently degrade ranking=semantic/hybrid to lexical with only a log line as signal; this tab is the single place to answer whether indexing is healthy, what is covered, what failed, and why. A row write enqueues its own job, so new content normally appears here as a write job that completes within seconds of the save.
It is system-wide and admin-only by platform convention (operators see all indexing; it is not a per-persona capability). All data is real index_jobs and vector-table state — no mocked dimensions. The page polls every 5 seconds so it reflects work as the worker, reconciler, and reaper complete it.
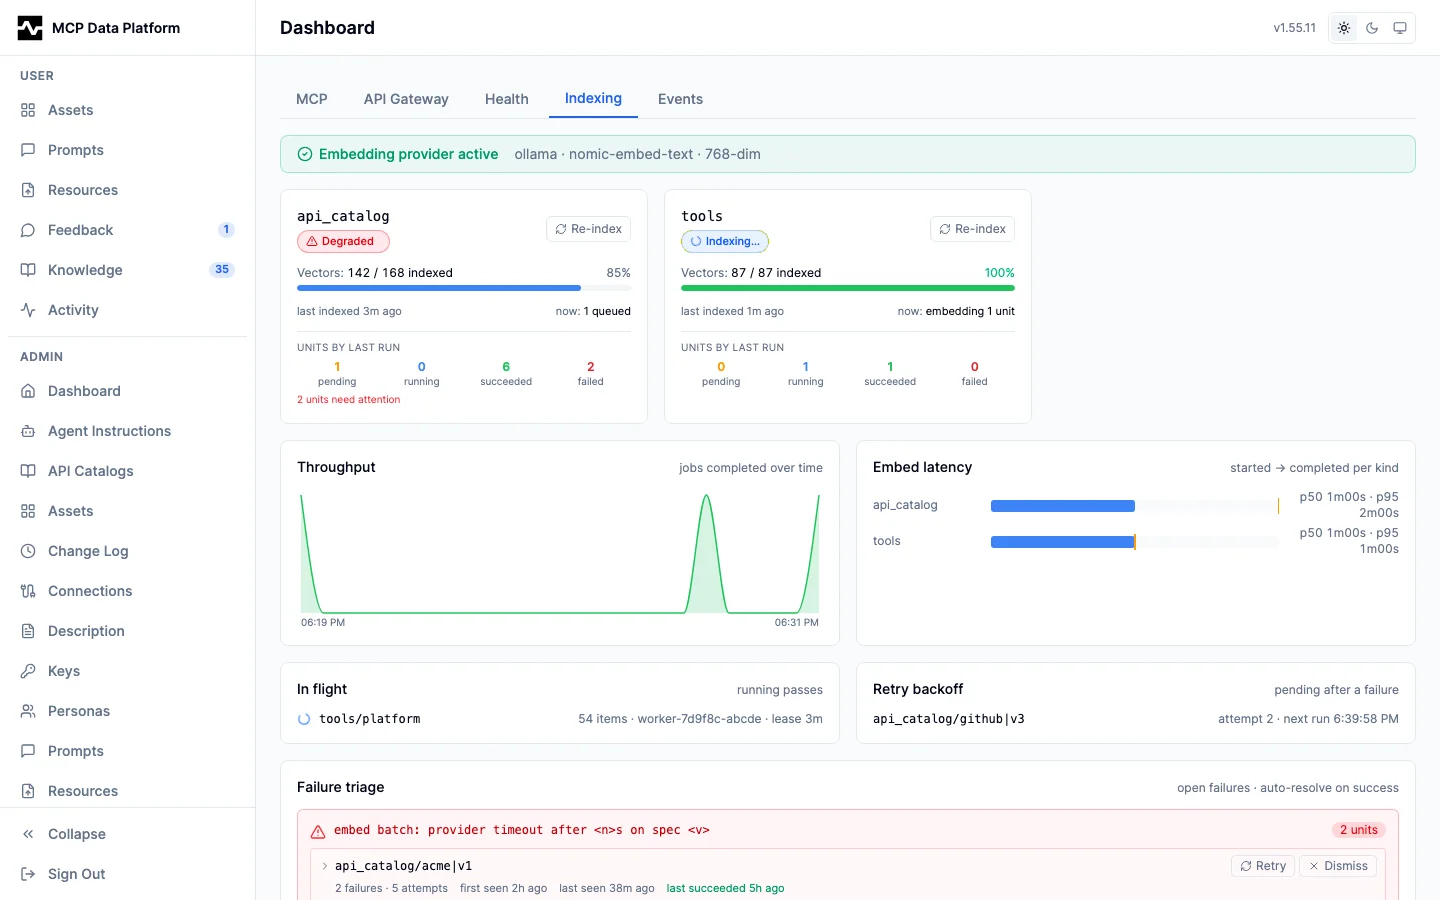
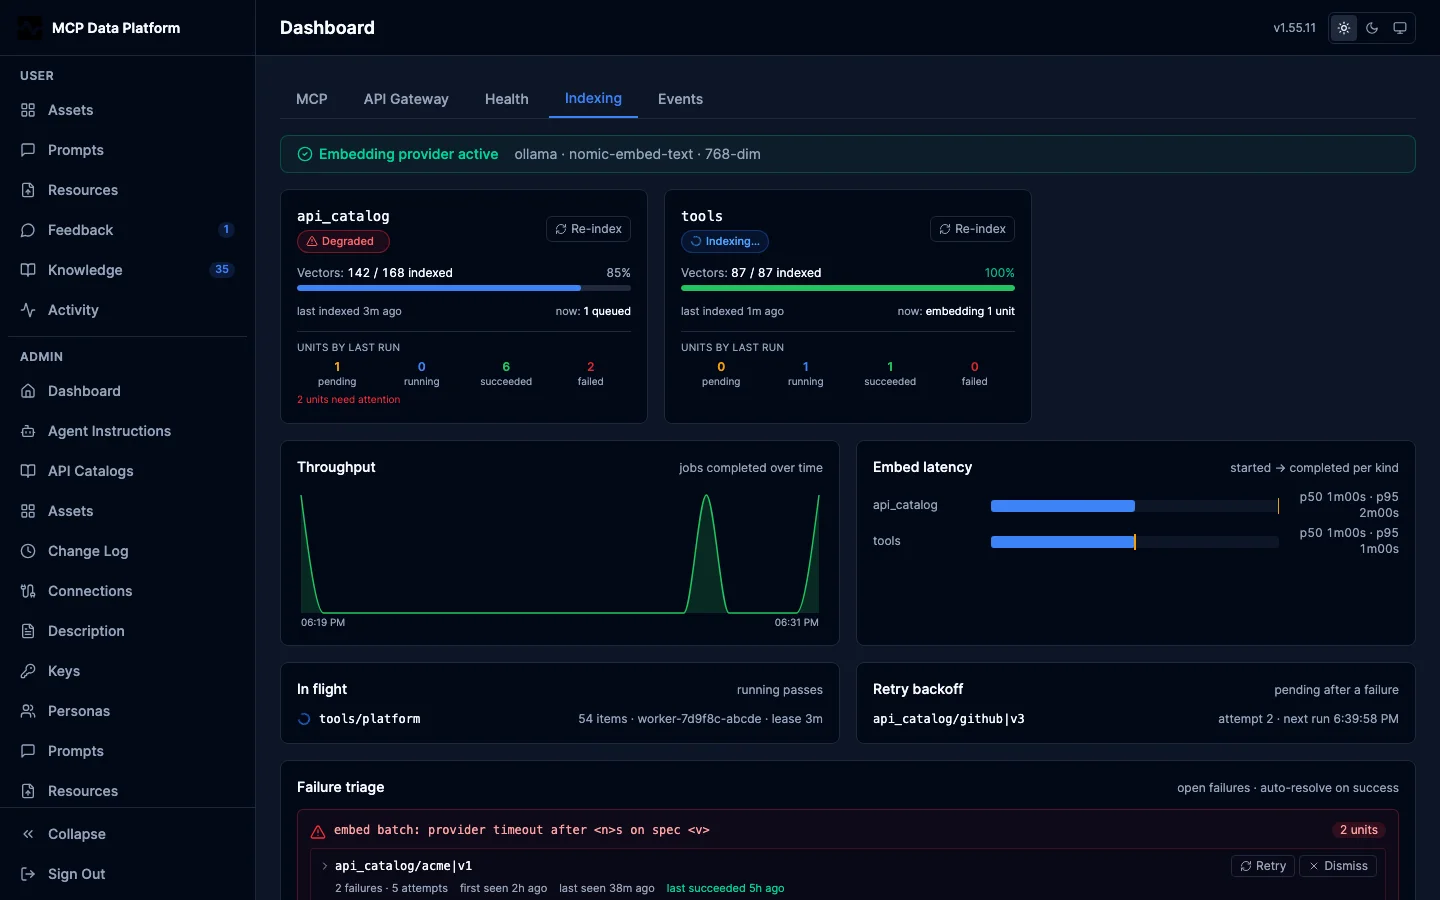
The tab includes:
- Provider health banner — The embedding provider's kind, model, and dimension, or a clear degraded state (noop / unconfigured) since a bad provider makes the whole index meaningless and pauses indexing.
- Per-kind health cards (summary-first) — Each kind leads with one plain health verdict computed server-side: Up to date (the single resting state for a fully-indexed, quiescent, failure-free kind), Indexing… (work in flight), or Degraded (an open failure or a coverage shortfall). Equivalent states look identical: every up-to-date kind shows the same green badge and the same
N / M · 100%coverage bar (api-catalog's expected comes fromoperation_count; tools writes its complete registered set atomically, so its indexed count is also its expected), and a recency line ("last indexed", or "fully indexed" for a kind seeded outside the queue, never "never"). The per-unit job-state breakdown ("units by last run") is shown only when there is active work or an open failure, so an up-to-date card is not cluttered with an all-zero or stale stat row. A Re-index button re-enqueues every out-of-sync unit of the kind. - Top callers — Shown when the call catalog is indexed (the
callskind): the callers and personas holding the largest share of recorded calls, each with its record count and share of the total, whether the persona is a service account or named incalls.exclude_personas, and a link to its persona editor. An automated caller that signs in with an API key and calls one tool per upstream record shows here as one caller under one persona holding most of the catalog; marking that persona as a service account stops its calls being recorded and removes the records it already wrote (see Excluding an automated caller). The counts are at most five minutes old. - Throughput timeline — Jobs completed per 15 minutes over the last 24 hours (d3 area), so an operator can see indexing keeping up or stalling.
- Embed latency — Per-kind duration of a successful pass, claim to completion, over the last 24 hours: p50 with a p95 marker, and p99, surfacing slow passes such as the CPU-only embedder case.
- In flight — Every running job, with worker id, lease countdown, and items-done progress for long passes. Its count matches the kind cards'
running. - Retry backoff — Pending jobs that already failed once, with attempt count and next run time: the count over the whole queue, and the newest 50 listed.
Throughput and Embed latency are read from Prometheus through the PromQL proxy, from the indexjob_* series the worker records as each job settles (see Background indexing). They cover the whole queue however large its backlog is. A deployment with no metrics backend shows one notice in their place; every other panel reads the platform's own tables. A coverage bar reads 100%, in green, only when every expected vector is indexed; a kind still short shows the figure floored to one decimal (99.6%), never rounded up.
- Failure triage (self-resolving) — Units with open failures, grouped by error signature. Each unit shows first-seen / last-seen timestamps, occurrence and attempt counts, and "last succeeded" context, with an expandable drill-in to the un-redacted error and the underlying job id. A failure auto-resolves (leaves the panel) once a later job for the same unit succeeds; Retry re-enqueues the unit and the card clears when it next succeeds, and Dismiss is the explicit fallback that resolves a failure (such as a removed consumer's leftover rows) that no future success will supersede. A unit that has failed repeatedly without ever succeeding also shows when its automatic retries resume ("retries paused, resuming in 4h"): the periodic sweep backs off rather than re-queueing a deterministic failure every five minutes, and saying so keeps a deferred unit from reading as one still being hammered. Retry ignores the deferral.
- Jobs drill-down — A filterable table (by kind and status) of recent jobs with trigger, attempts, last update, and error. The trigger says what produced the job: write for a row mutation's own enqueue (a saved asset, an edited knowledge page, an approved prompt, an uploaded resource), reconciler for a timer-driven gap sweep, manual_retry for the operator escape hatch. Routine timer-driven reconciler successes for a unit (which every replica re-runs on its own schedule) are collapsed into a single "synced ×N" row so they do not drown the table.
The existing per-catalog embedding badges in the API Catalogs panel remain; this tab is the cross-kind superset.
Activity (Dashboard tabs)
The admin Dashboard hosts the platform activity views as tabs: MCP, API Gateway, Health, Indexing, Events, and Notifications. (Indexing is documented above.) The first four work across configurable time ranges (1h, 6h, 24h, 7d).
MCP
The MCP tab provides platform-wide analytics over MCP tool-call activity.
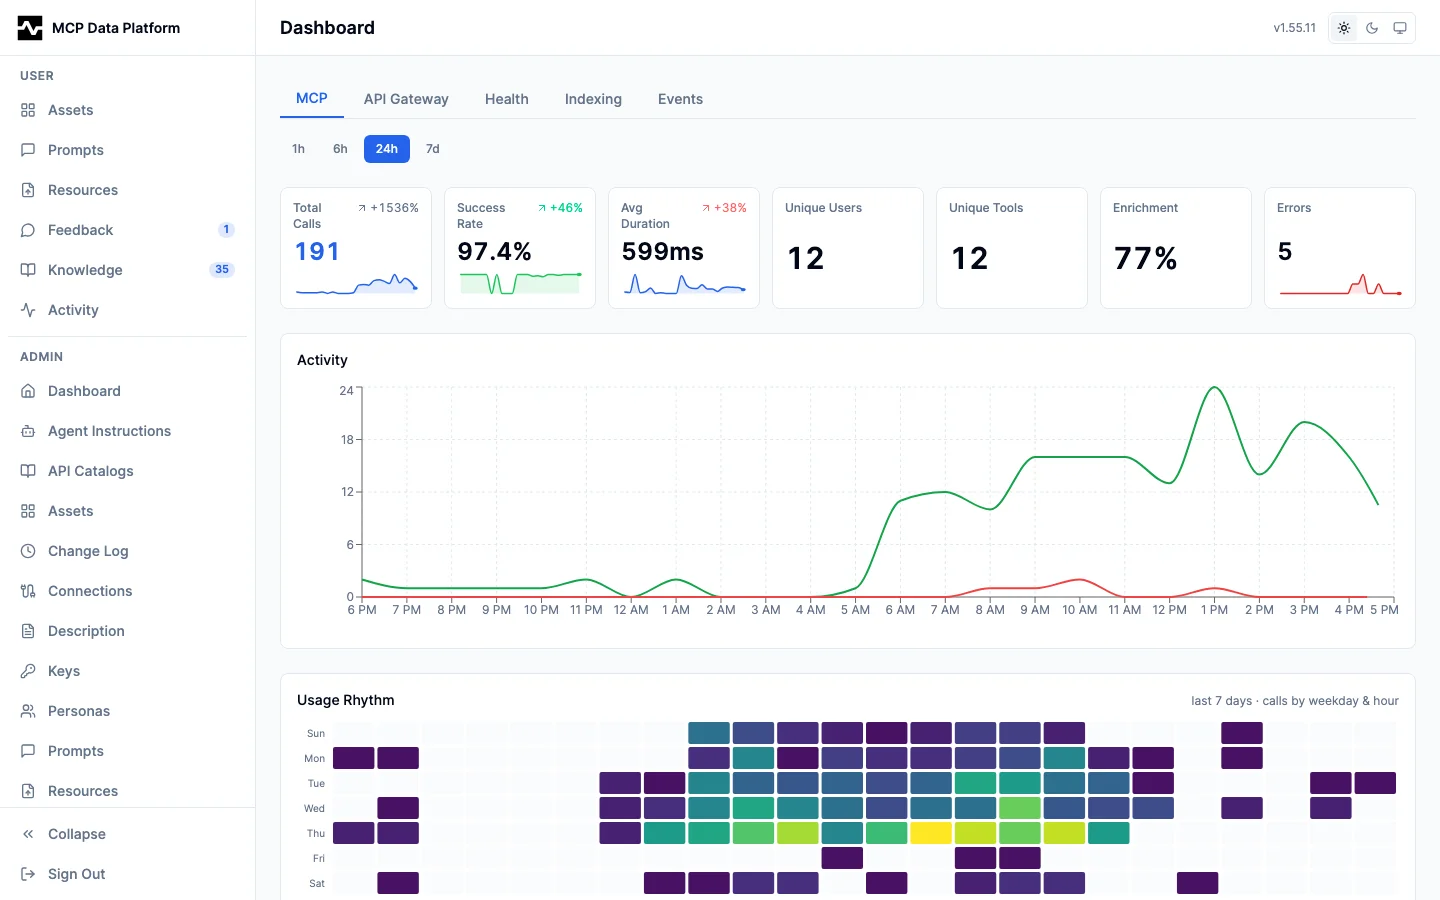
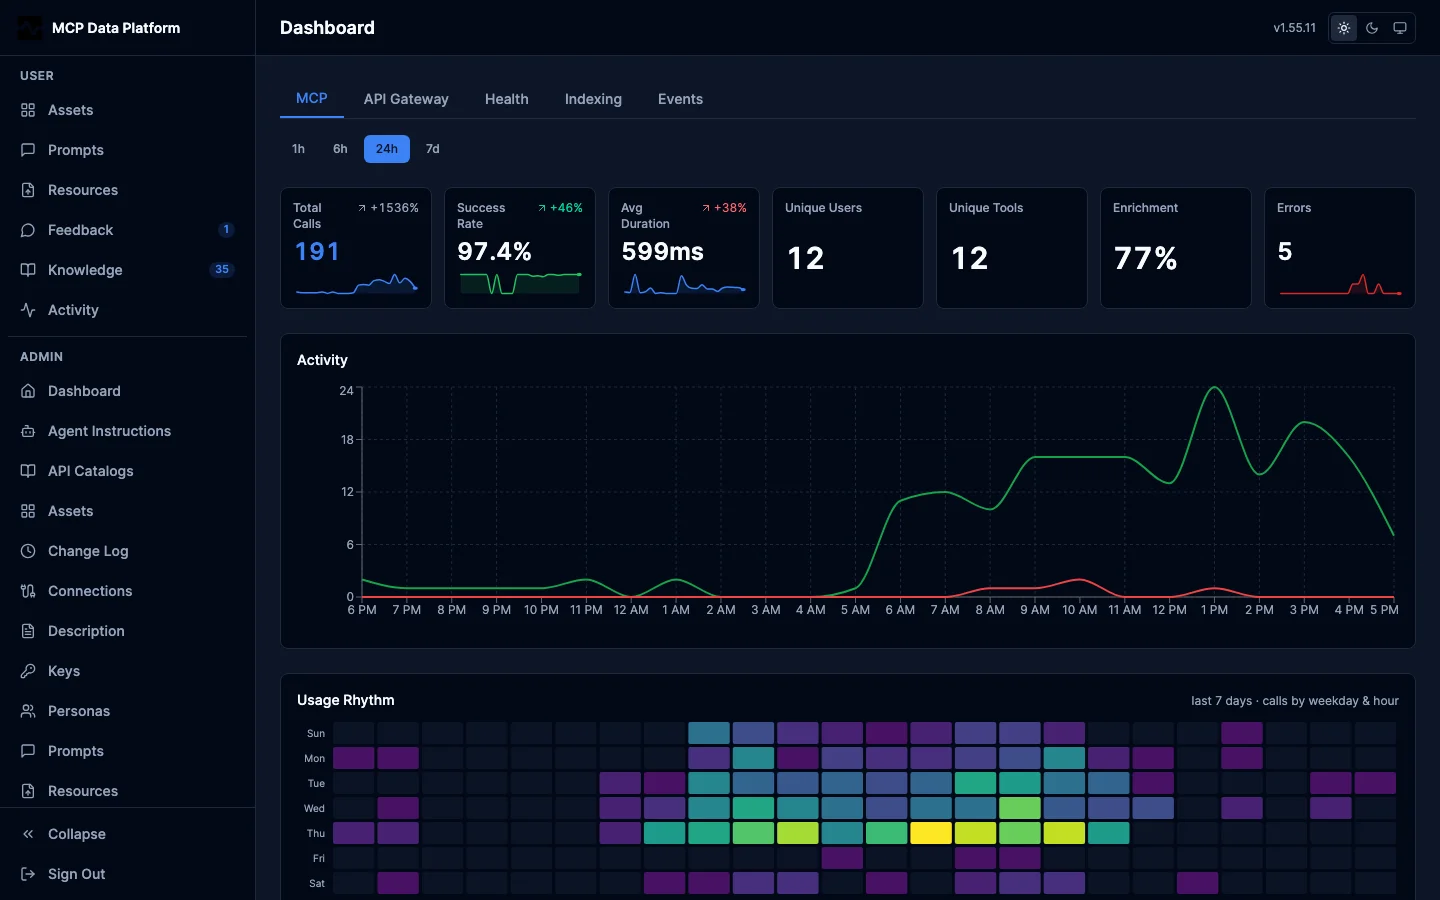
Includes summary cards, the activity timeline, and top tools / top users charts — focused on MCP tool calls with performance percentiles and error tracking.
API Gateway
The API Gateway tab visualizes outbound REST gateway traffic proxied through the platform.
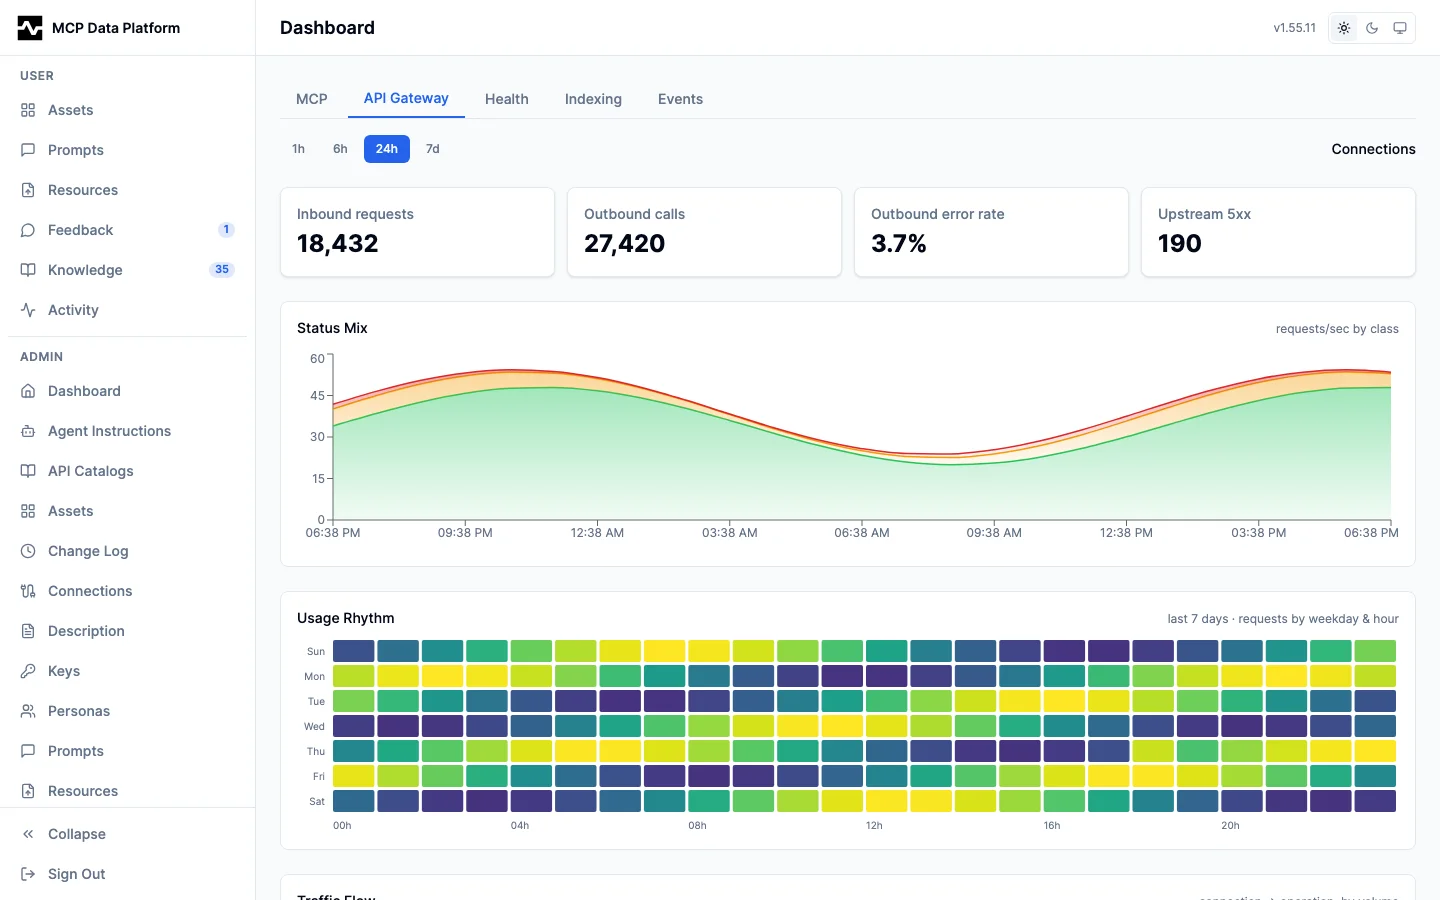
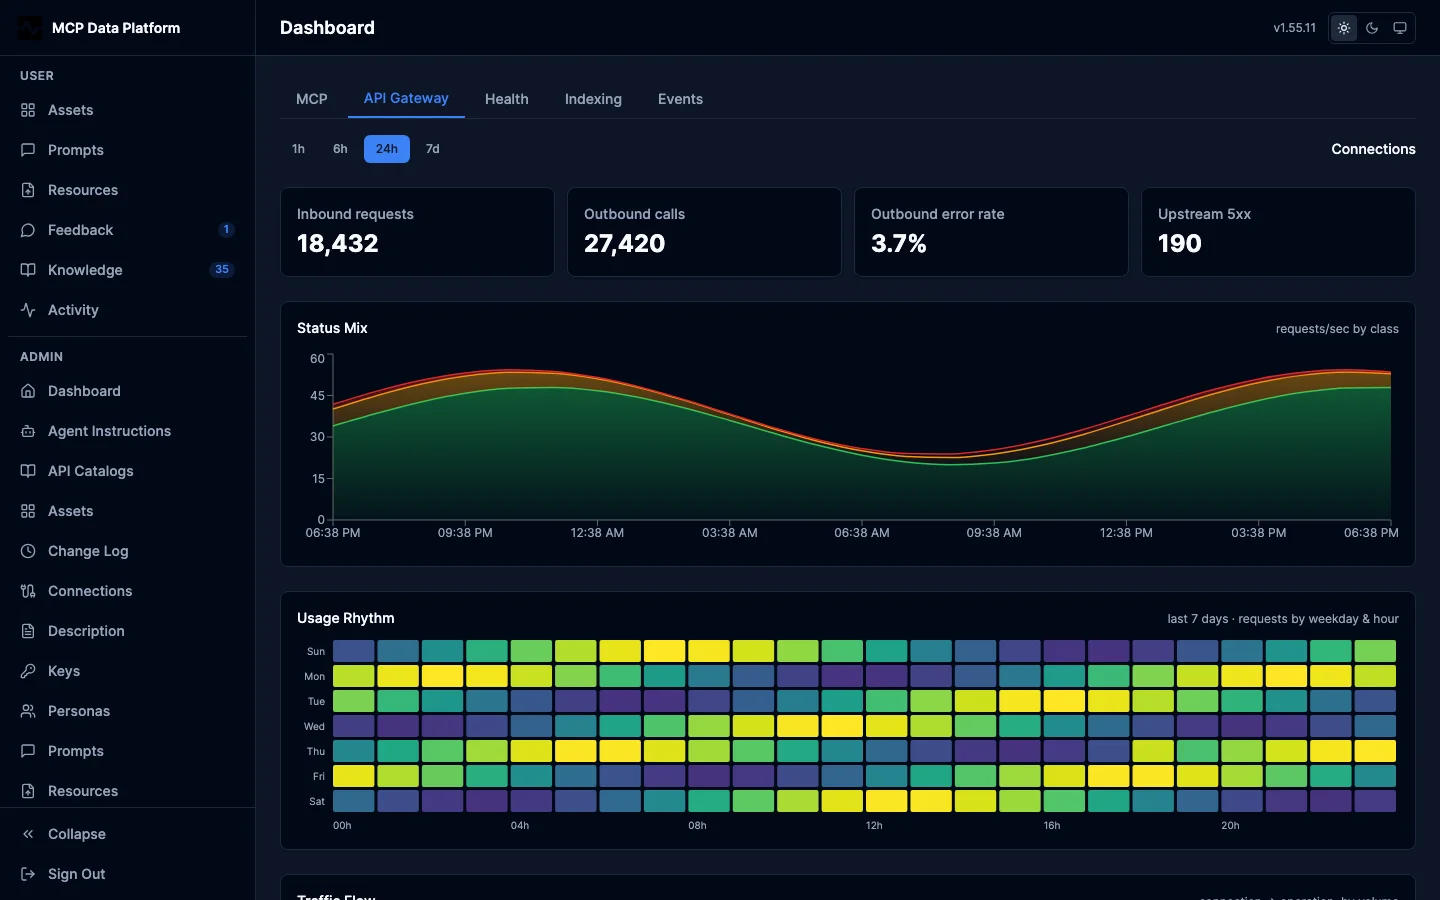
Includes the connection-to-operation traffic flow (Sankey), an inbound-vs-outbound health split by status category, and breakdowns by status class, method, and calling identity.
Outbound calls by principal splits the upstream calls the gateway made by the persona that caused them, at the root level over every connection and again inside one connection's drilldown. It answers the question the connection totals cannot: whether a connection's volume is one automated ingestion account or the analysts sharing it, which is what decides whether a spike is a runaway job or genuine use. A call the platform could not attribute reads as unknown; traffic recorded before the persona label existed groups under (none). The label is bounded by the deployment's persona definitions, so it does not grow with the number of people using the platform — see Observability.
Health
The Health tab reports per-node platform health scraped from Prometheus.
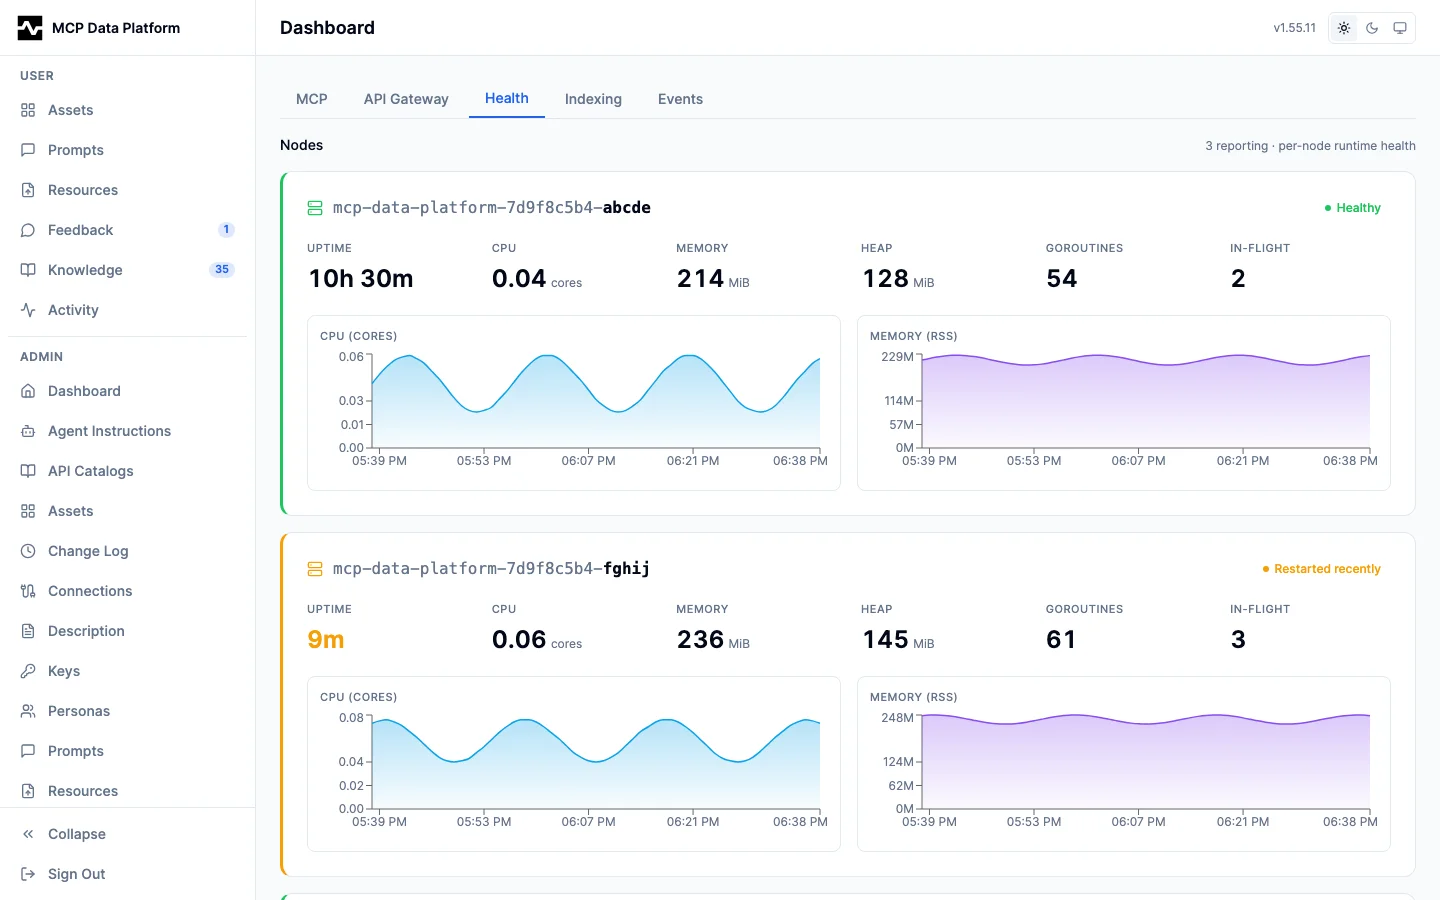
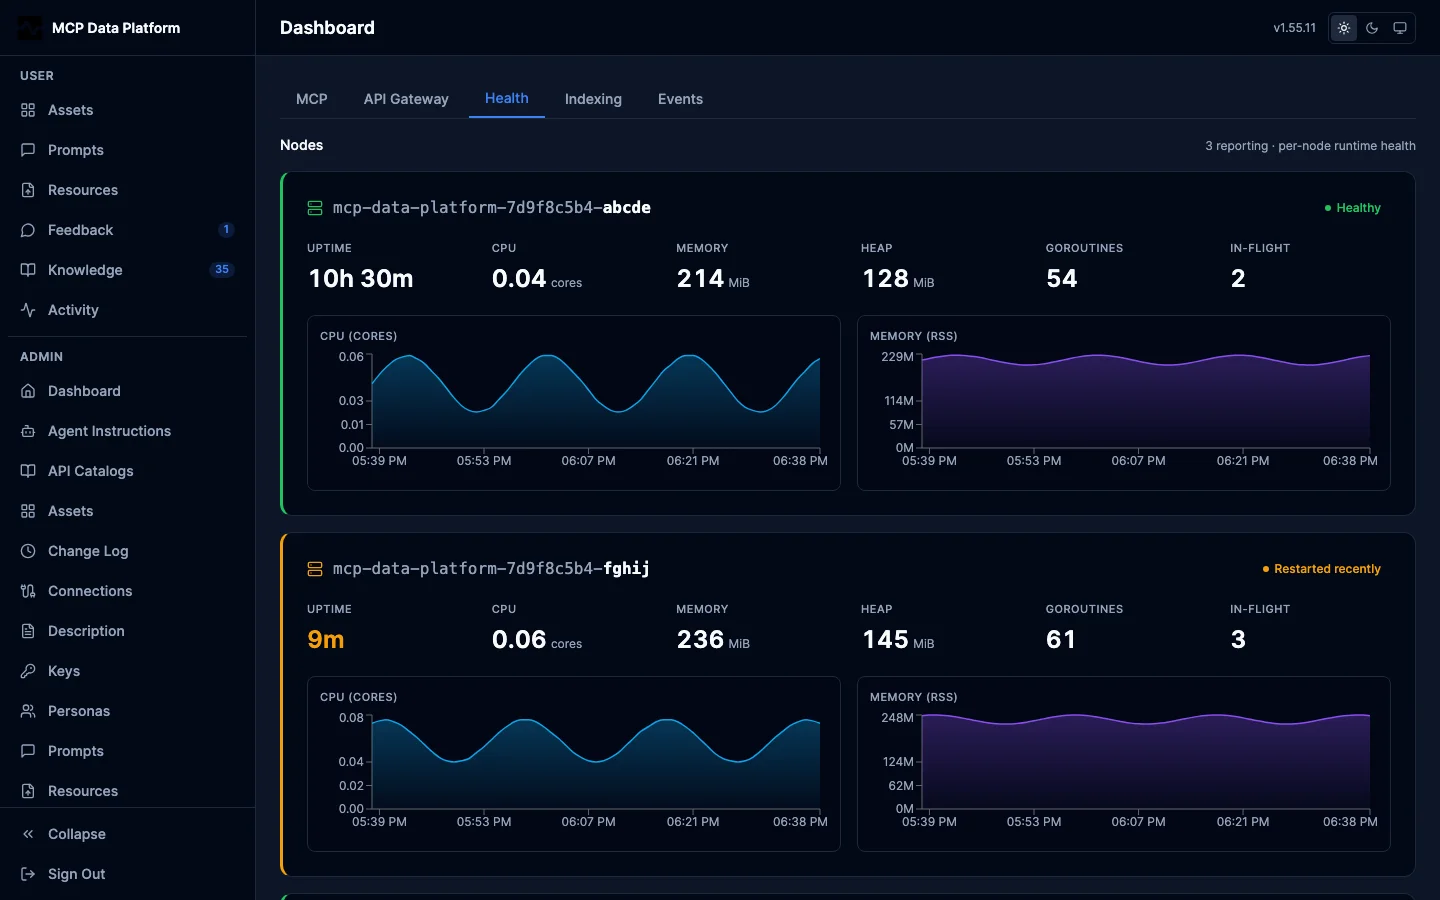
Per-node uptime, CPU, resident memory, heap, and goroutine counts across the platform fleet, with any missing metric rendered as a dash.
Events
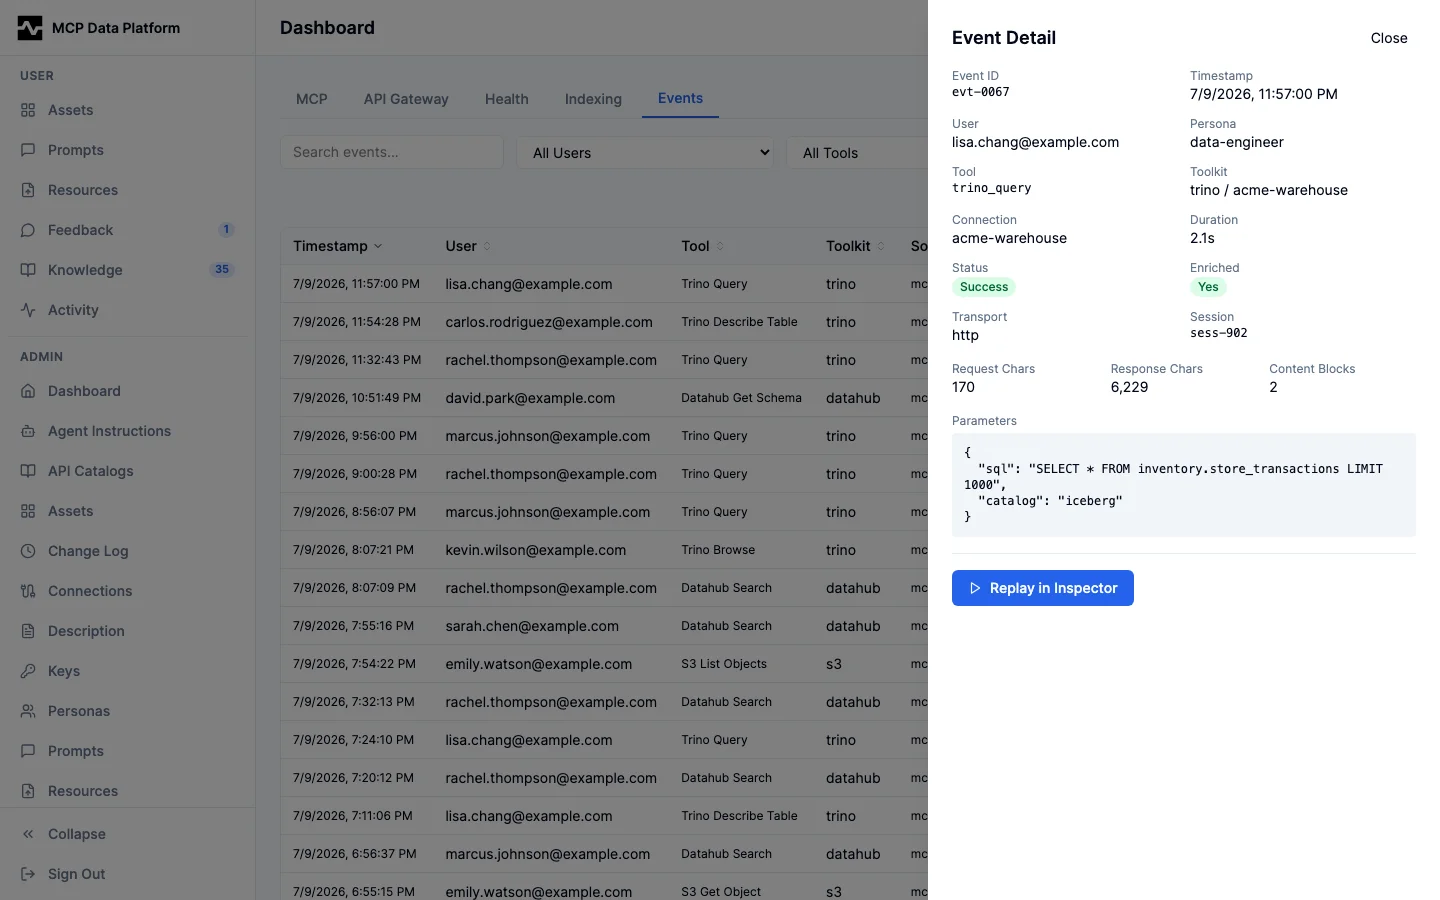
The Events tab provides a searchable, filterable log of every tool call.
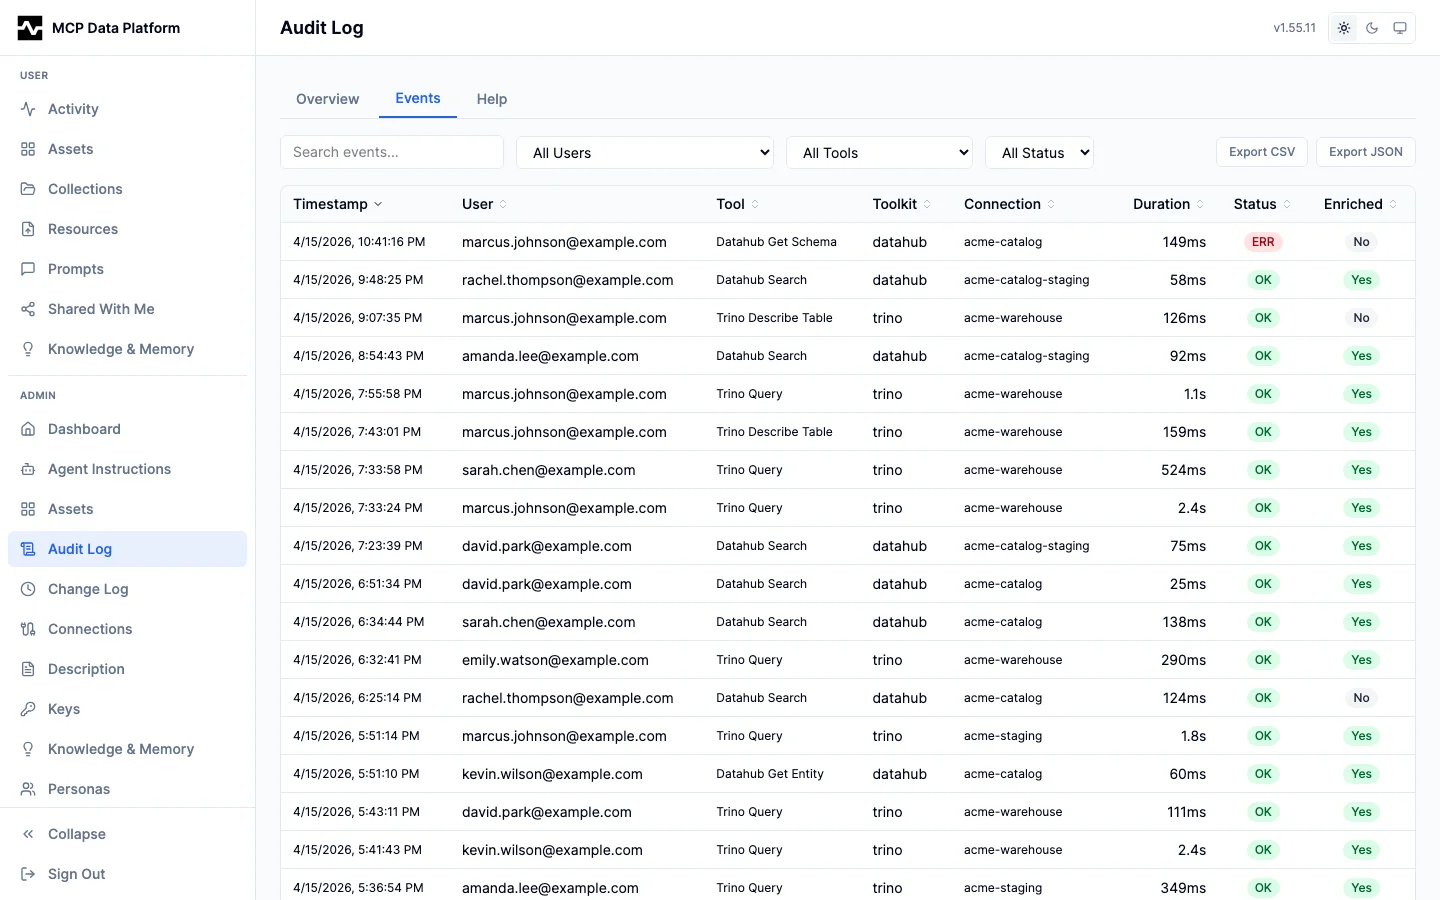
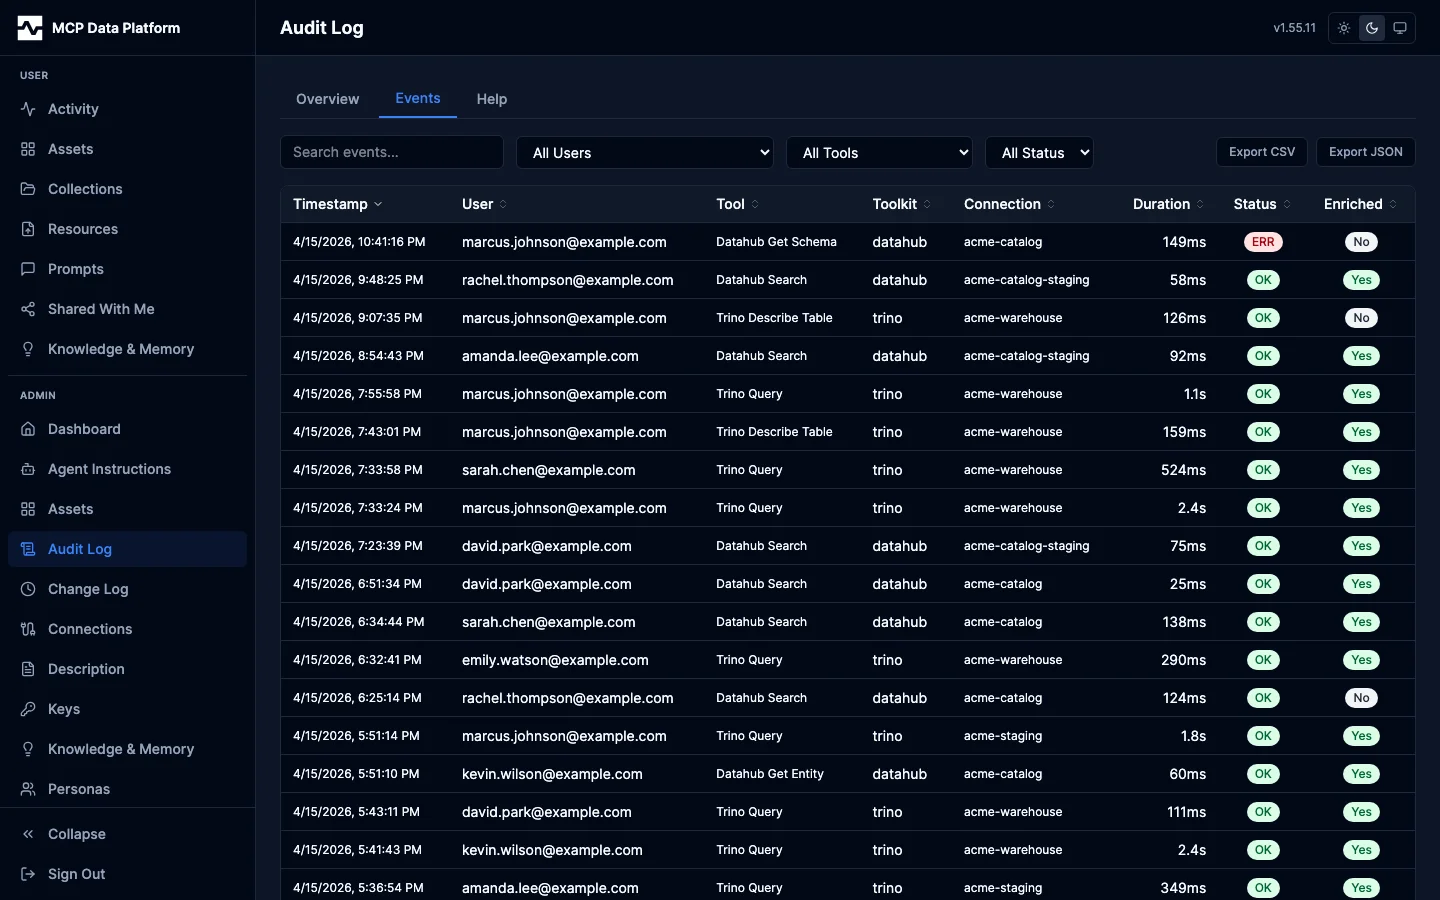
Features:
- Filters — User, tool, status (success/failure), and time range dropdowns, plus a Session ID box that narrows the table to one session's calls
- Who made the call — The User column and the user filter name the principal, not just an address: a person reads as their address, while a managed script and an API key carry a script or apikey marker, their name, and the address they act for. An owner's scripts all act for one address, so the filter offers each principal separately rather than repeating that address once per script.
- Sortable columns — Timestamp, user, tool, toolkit, connection, duration, status, and enrichment
- Purpose — The one sentence the agent stated about why the call was made, truncated to fit and shown in full on hover and in the drawer. A dash means none was stated: the tool is outside the gated set, or the caller (an MCP App, a managed script, the REST shim, a portal run) cannot thread arguments at all. The column does not sort — alphabetical order over free prose means nothing — but the search box matches it, so an operator can find every call made for a given task.
- Export — Export CSV and Export JSON buttons
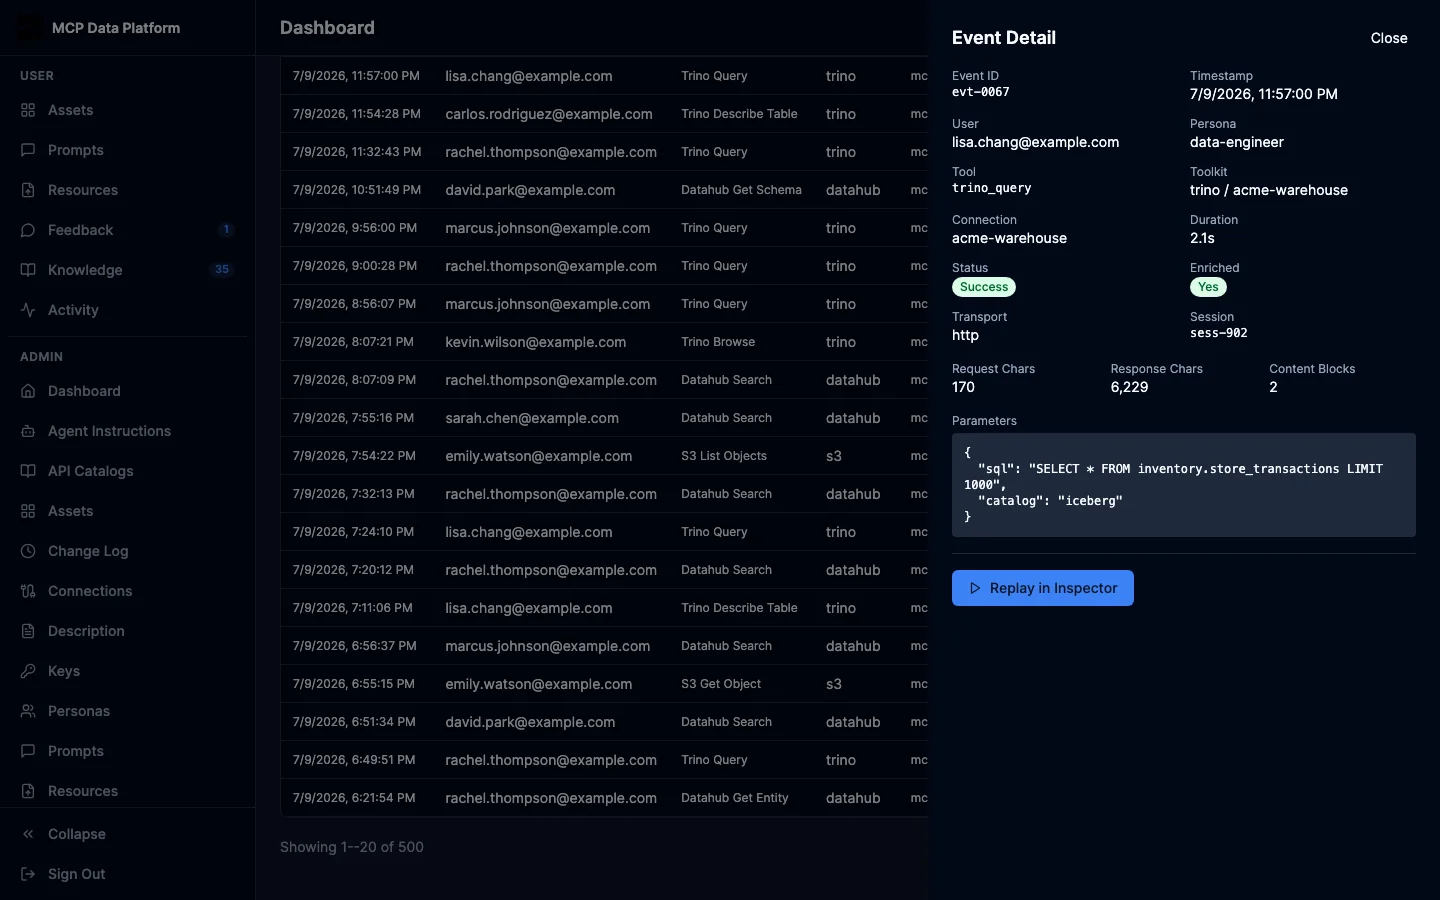
- Event detail drawer — Click any row to open the full detail:
- Identity — User email, persona, session ID (a link to the session)
- Execution — Tool name, toolkit, connection, duration
- Status — Success/failure, enrichment status
- Transport — HTTP or stdio, request/response sizes, content block count
- Purpose — The full stated purpose, above the parameters; omitted when none was stated
- Parameters — Full request parameters as JSON
Notifications
The Notifications tab is the admin read on email delivery: whether the platform's notification emails are reaching people, and what happened to the ones that did not. Without it, a broken SMTP relay is invisible until a user reports never receiving a share.
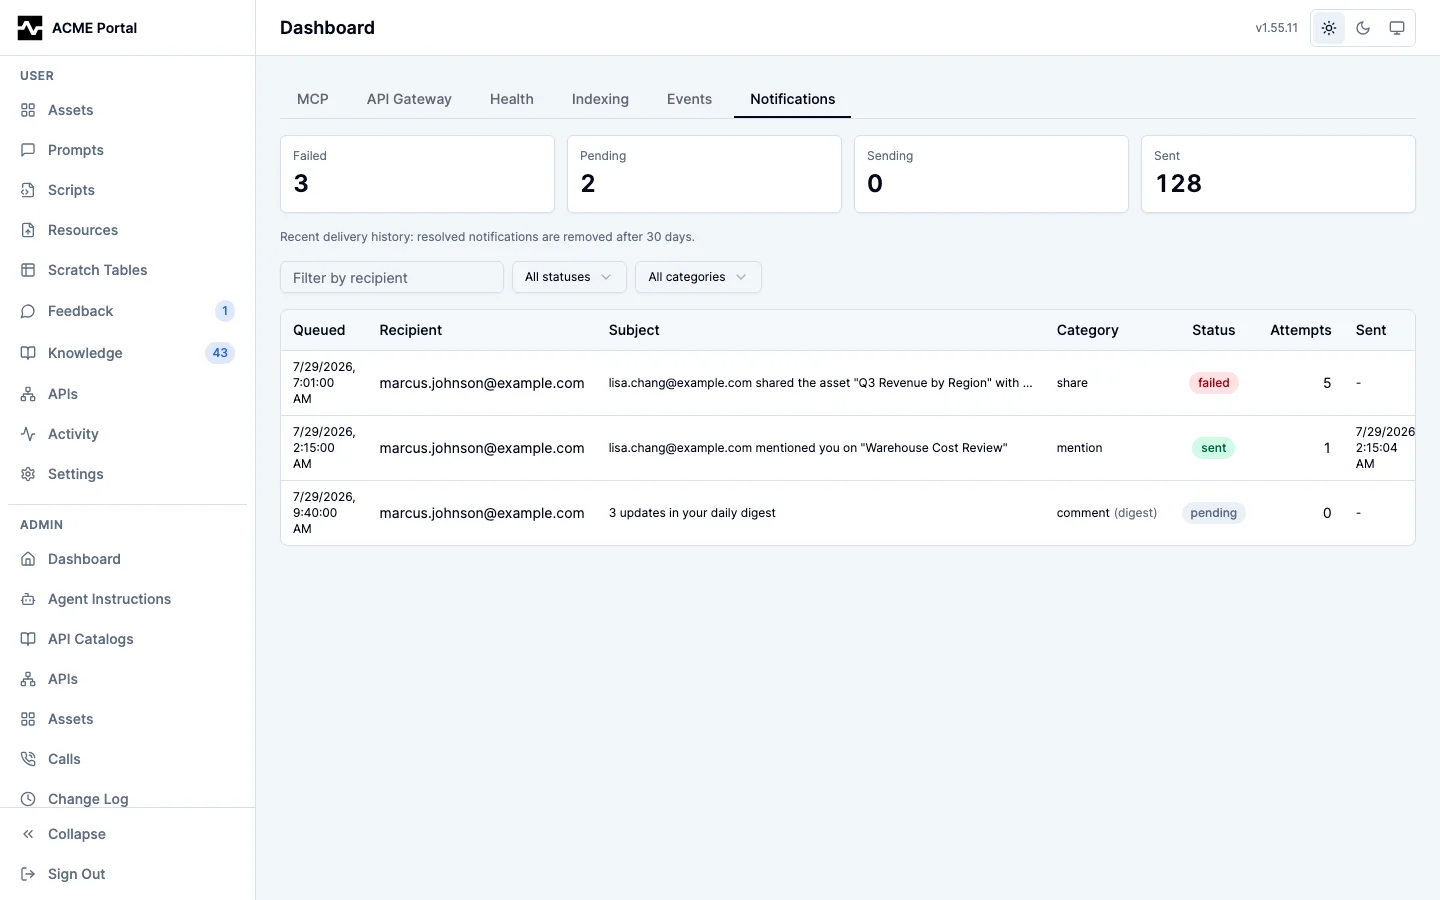
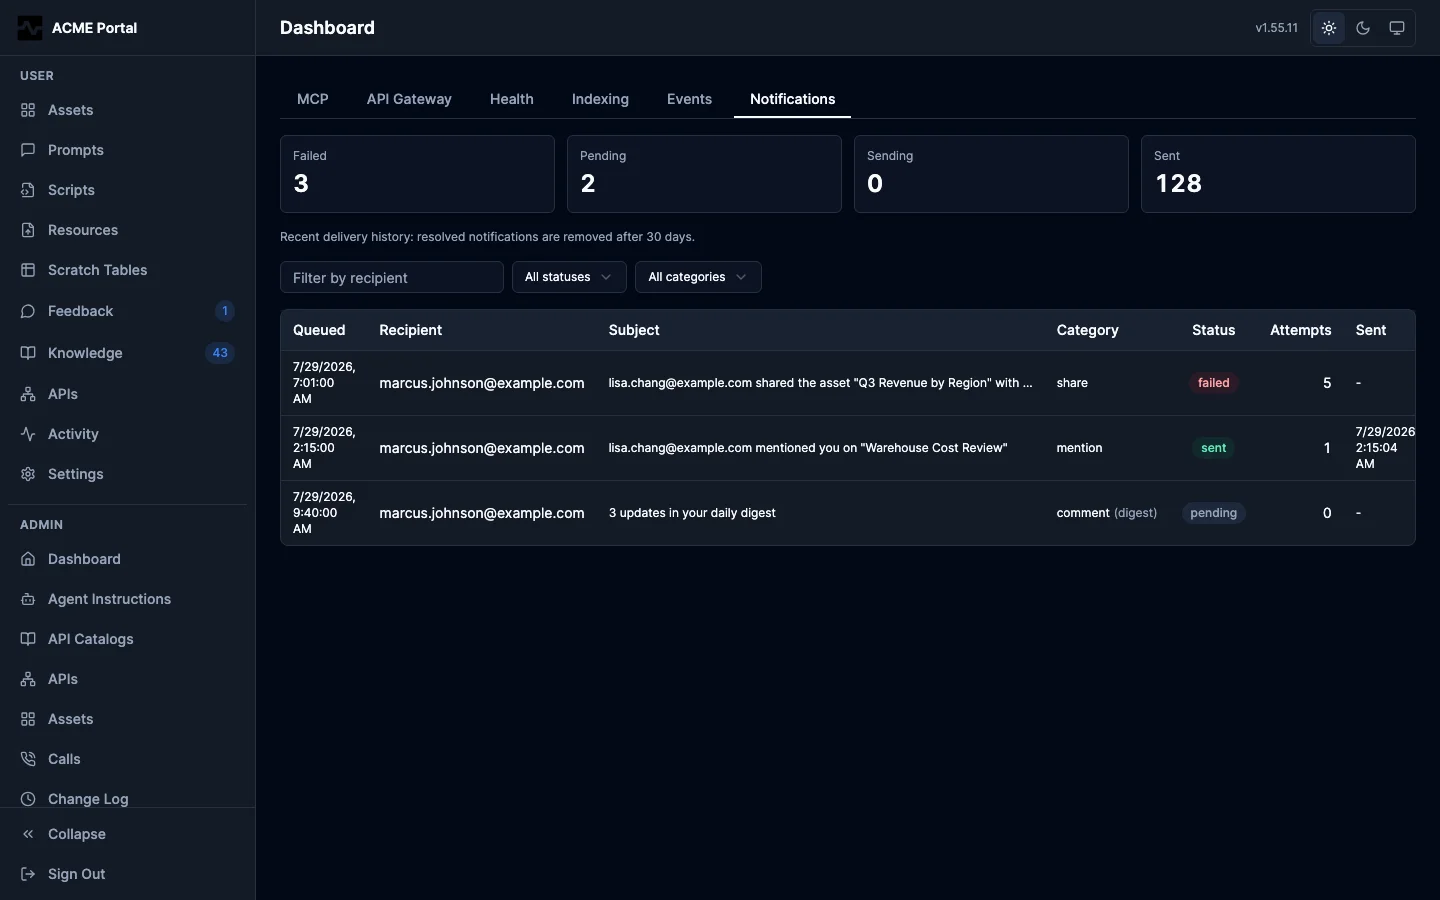
Counts by status sit above the list — Failed, Pending, Sending, Sent — as an at-a-glance health read, and each count doubles as a filter. The list shows every queue row with when it was raised, its recipient, the subject line the email carried, its category, delivery status, and attempt count. Clicking a row opens the detail, which exists for the failure case: the error the mail server returned, verbatim, alongside how many attempts the queue made before giving up.
Filters narrow by recipient, status, and category. The tab is admin-only and shows every recipient's rows; each user sees their own activity in Settings > Recent notifications in the user portal.
It shows recent history rather than an archive: the send worker purges resolved rows on a retention schedule (30 days by default, undelivered rows after 7), and the effective window is stated above the list so an empty view is not mistaken for a quiet week. See Email Notifications for the delivery semantics behind the statuses.