Audit Logging
Every tool call flows through the audit logging middleware, which records who called what, when, how long it took, and whether it succeeded. Audit logs are stored in PostgreSQL and automatically cleaned up based on a configurable retention period.
Prerequisites
Audit logging requires:
- A PostgreSQL database (version 13+)
- The
database.dsnconfiguration set - Both
audit.enabledandaudit.log_tool_callsset totrue
Database migrations run automatically on startup and create the audit_logs table.
Configuration
database:
  dsn: "${DATABASE_DSN}"

audit:
  enabled: true
  log_tool_calls: true
  log_parameters: true
  redact_keys: ["password", "token"]
  delivery: async          # async (default) | sync
  retention_days: 90
| Option | Type | Default | Description |
|---|---|---|---|
database.dsn |
string | - | PostgreSQL connection string. Required for audit logging. |
audit.enabled |
bool | false |
Master switch for audit logging. |
audit.log_tool_calls |
bool | false |
Log every tools/call request. Both this and enabled must be true. |
audit.log_parameters |
bool | true |
Capture tool-call arguments. Set false to drop them; parameters then holds only a result a tool reports about the call's outcome, or null. See Parameter Sanitization. |
audit.redact_keys |
list of strings | [] |
Top-level argument keys whose values become [REDACTED] before the event leaves the request path. Case-insensitive; top-level only. See Parameter Sanitization. |
audit.delivery |
string | async |
Store-write path: async (best-effort, never blocks the tool call) or sync (writes on the request goroutine for backpressure and zero queue drops). See Delivery semantics. |
audit.retention_days |
int | 90 |
Days to keep audit logs before automatic cleanup. |
If audit.enabled is true but no database is configured, the platform logs a warning and falls back to a no-op logger.
What Gets Logged
Every successful or failed tool call produces one row in audit_logs:
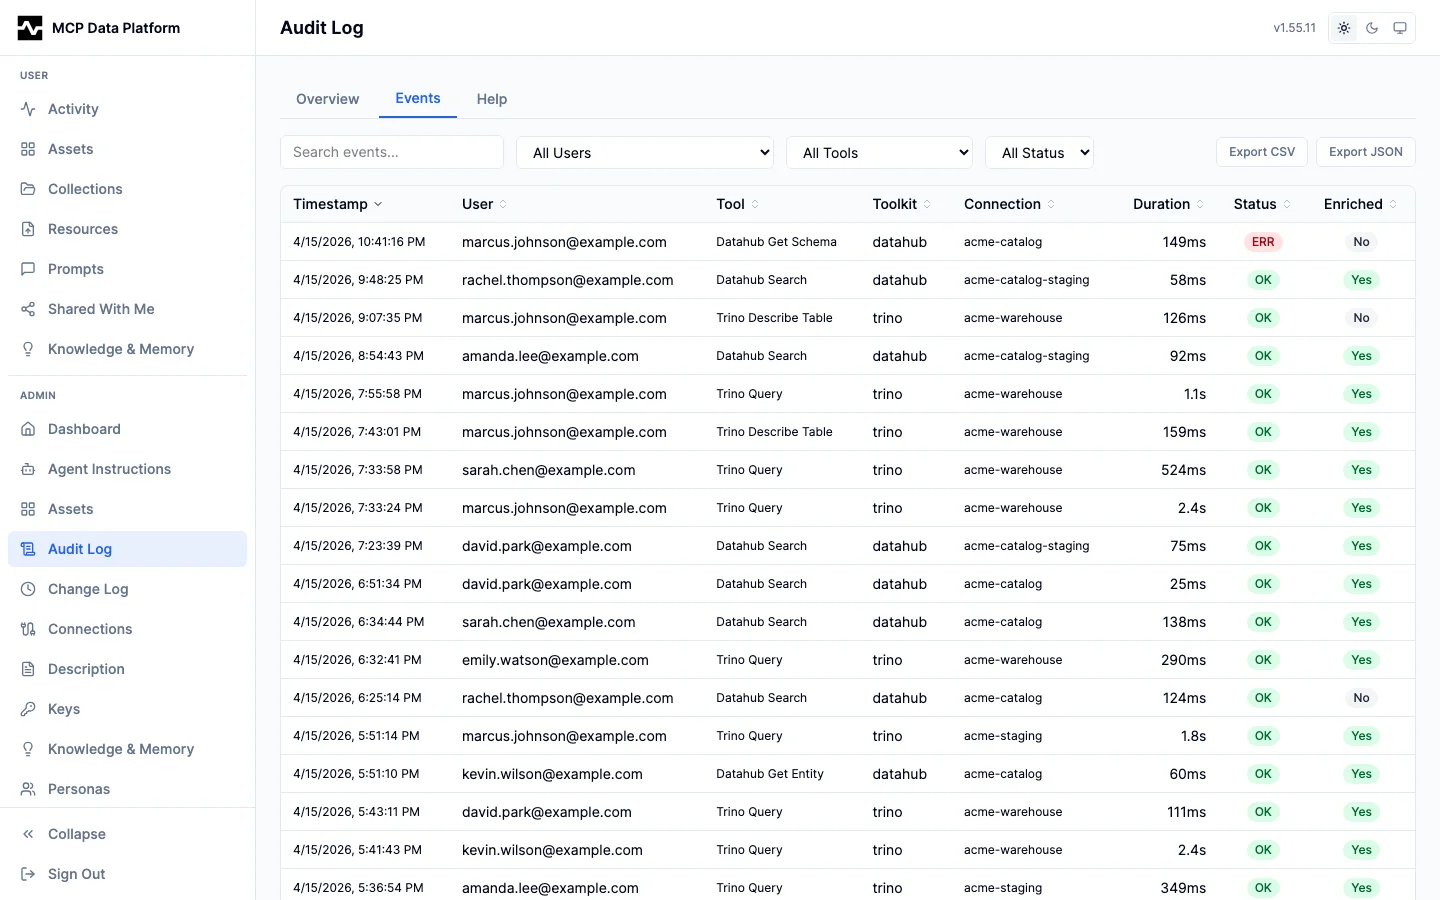
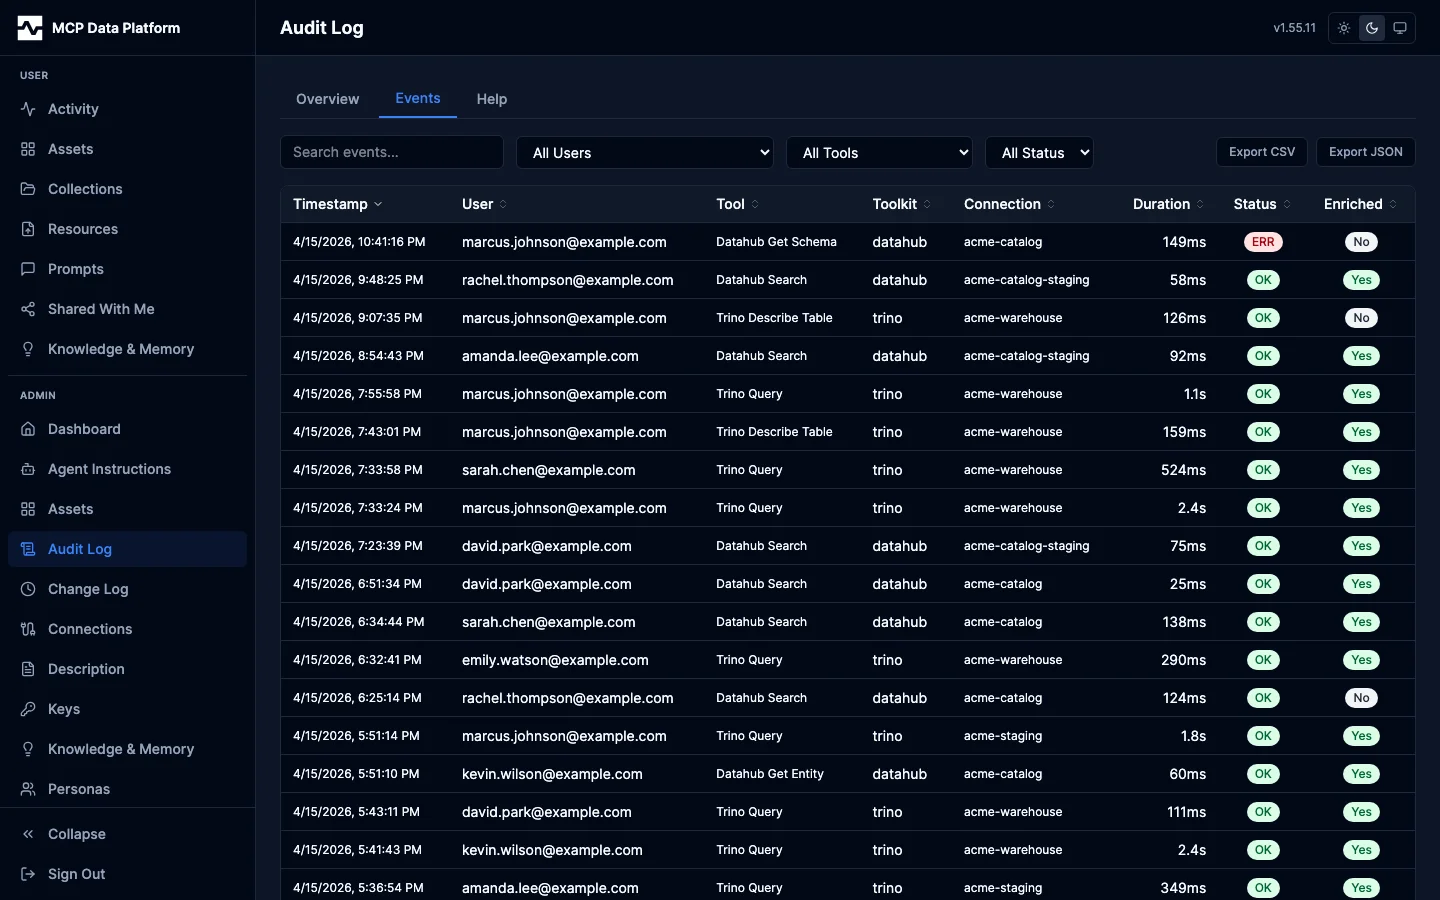
Those rows are what the portal's Admin > Dashboard > Events tab lists, filtered and sorted; the JSON below is one row of it.
{
  "id": "3sK2DlE7x9mPqR4vNw8bYA",
  "timestamp": "2026-02-04T10:30:00.123Z",
  "duration_ms": 152,
  "request_id": "req-a1b2c3d4e5f67890abcdef1234567890",
  "user_id": "[email protected]",
  "user_email": "[email protected]",
  "persona": "analyst",
  "tool_name": "trino_query",
  "toolkit_kind": "trino",
  "toolkit_name": "production",
  "connection": "prod-trino",
  "purpose": "Checking whether order volume fell in the western region for the board deck.",
  "parameters": {"sql": "SELECT count(*) FROM orders"},
  "success": true,
  "error_message": "",
  "event_kind": "mcp_tool_call",
  "created_date": "2026-02-04"
}
Field Reference
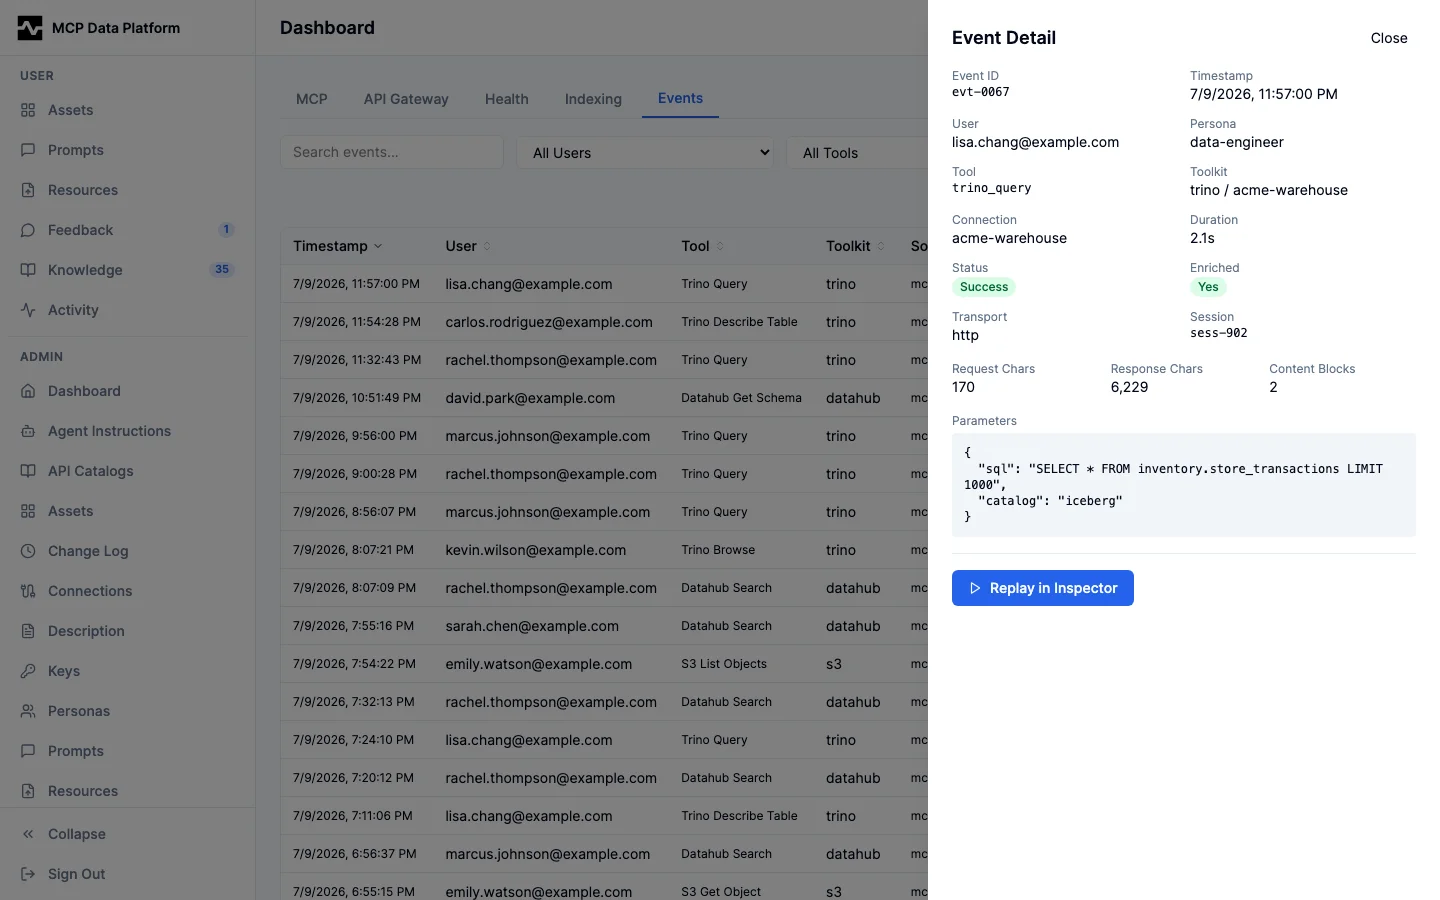
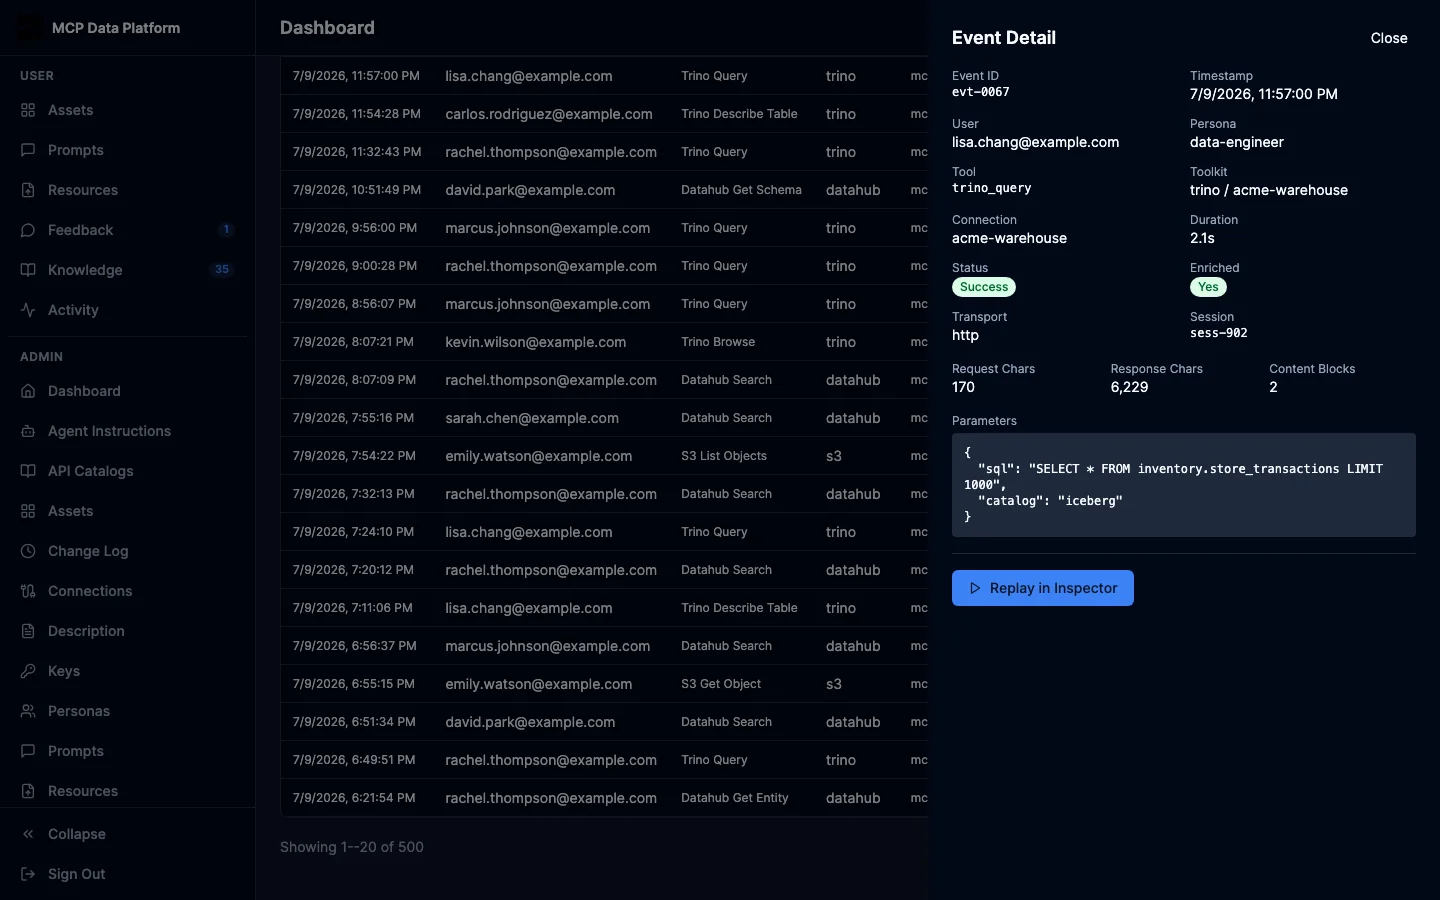
Opening a row in the Events tab shows one call's identity, execution and result: the fields the table below defines.
| Field | Type | Description |
|---|---|---|
id |
VARCHAR(32) | Cryptographically random event ID (base64url-encoded, 16 bytes). |
timestamp |
TIMESTAMPTZ | When the tool call started. |
duration_ms |
INTEGER | Wall-clock time from request start to handler completion, in milliseconds. Includes rule enforcement and semantic enrichment time. |
request_id |
VARCHAR(255) | Unique request ID generated by the auth middleware (hex-encoded, 16 bytes). |
user_id |
VARCHAR(255) | The principal that made the call, which is not always a person: an OIDC sub (or OAuth token subject) for someone signed in, apikey:<name> for an API key, and script:<name> for a managed-script run. See Who made the call. |
user_email |
VARCHAR(255) | The address the principal acts for: the signed-in person's own, the script owner's on a run, or the address configured for an API key (a key that configured none authenticates as the synthetic <name>@apikey.local). It is not an identity — every one of an owner's scripts writes the same address — so user_id is what separates two rows. |
persona |
VARCHAR(100) | Resolved persona name (e.g., analyst, admin). Set by the authorizer based on the user's roles. |
tool_name |
VARCHAR(255) | MCP tool name (e.g., trino_query, datahub_search, s3_list). For gateway-proxied tools, <connection>__<remote_tool> (e.g., vendor__list_contacts). |
toolkit_kind |
VARCHAR(100) | Toolkit type: trino, datahub, s3, or mcp (proxied through the gateway toolkit). |
toolkit_name |
VARCHAR(100) | Toolkit instance name from configuration (e.g., production, staging). For gateway proxied tools, the gateway toolkit's own name (typically primary). |
connection |
VARCHAR(100) | Connection name. For native toolkits, the connection used to route the call (e.g., prod-trino). For gateway proxied tools, the upstream MCP connection name (e.g., vendor) — populated via the registry's ConnectionResolver interface so per-upstream auditing is accurate without relying on caller-supplied args. |
purpose |
TEXT | The one sentence the caller gave for why this call was made: the wider task it serves. Stated by the agent as the purpose argument and taken off the request before the tool saw it. NULL on rows written before the column existed; empty on a call that stated none, including every call by a caller that cannot thread arguments (an MCP App, a script run, the REST shim). It is not an argument value, so Parameter Sanitization does not apply to it. See Why a call happened. |
parameters |
JSONB | Tool call arguments with sensitive values redacted, plus a result key when the tool reports facts about the call's outcome: an API gateway page walk records pages_fetched, items_merged, and stopped_by there. See Parameter Sanitization. |
success |
BOOLEAN | true if the tool handler returned without error and IsError was not set. |
error_message |
TEXT | Error description if success is false. |
session_id |
VARCHAR(255) | Session identity. For agents (source=mcp) this is the explicit session handle (dps_…) or the transport session ID. Portal-driven runs (source=admin) carry a distinct portal session ID (dpp_…) so they are attributable and never collide with an agent session. Links tool calls within the same session for pattern analysis. |
response_chars |
INTEGER | Character count of the tool response. |
content_blocks |
INTEGER | Number of content blocks in the tool response. |
request_chars |
INTEGER | Character count of the tool request parameters. |
transport |
VARCHAR(50) | Transport type: stdio or http. |
source |
VARCHAR(50) | Caller class. mcp = agent over a real MCP transport. rest = external automation through the gateway REST shim (NiFi, cronjobs, integrations). admin = portal-driven tool execution via the admin REST API. See Caller class via source. |
enrichment_applied |
BOOLEAN | Whether semantic enrichment was applied to this tool call's response. |
authorized |
BOOLEAN | Whether the tool call was authorized by the persona system. |
enrichment_tokens_full |
INTEGER | Estimated tokens for the full (non-dedup) enrichment content. Uses chars / 4 approximation. |
enrichment_tokens_dedup |
INTEGER | Estimated tokens for the dedup enrichment content. 0 when full enrichment was sent. |
enrichment_mode |
VARCHAR(20) | Enrichment mode used: full, summary, reference, none, or empty (not enriched). |
event_kind |
VARCHAR(64) | High-level event category: mcp_tool_call and apigateway_invoke for tool calls, plus prompt_serve, resource_read, resource_move, script_run and admin for the platform's other audited acts. Lets the Activity view split gateway traffic from MCP tool calls. See Event kind. |
created_date |
DATE | Partition key derived from timestamp. Used for retention cleanup. |
Why a call happened
Every other field on an audit row records what a call did. The purpose field records why. Data-access tools advertise a purpose argument on their input schema, and the agent states, in one sentence, the wider task it is working on and why the call serves it — the question behind the query, not a restatement of the arguments. The platform takes the argument off the request before the tool handler (or a gateway-proxied upstream server) sees it and writes it to the row's purpose column.
This is what turns a row like trino_query / SELECT ... FROM orders into something a data owner can act on. "Checking whether order volume fell in the western region for the board deck" tells them which decision the data fed; the SQL alone does not.
Two things follow from purpose living in its own column rather than in parameters:
- Redaction does not apply to it. It is not an argument value, so
audit.redact_keysandlog_parametersleave it alone. The schema description tells the agent not to repeat argument values in it and never to put personal data or secrets in it. - Search covers it. The admin events search (
?search=) matchespurposealongside user, tool, toolkit, connection, persona, and error message, so an operator can find every call made for a given task.
Only the gated tools advertise the argument, and only they refuse a call that omits it — but a purpose stated on any other tool is taken off the request and recorded on its row just the same, so a sentence an agent volunteers on manage_table reaches the operator reading the log. purpose is empty on a call that stated none, which includes every call by a caller that cannot thread arguments at all — an MCP App's sandboxed call, a managed script run, the gateway REST shim, the admin tool runner. It is NULL on rows written before the column existed. Which tools carry it, and whether a call that omits it is refused, are set by the purpose config block.
Sessions read back from the log
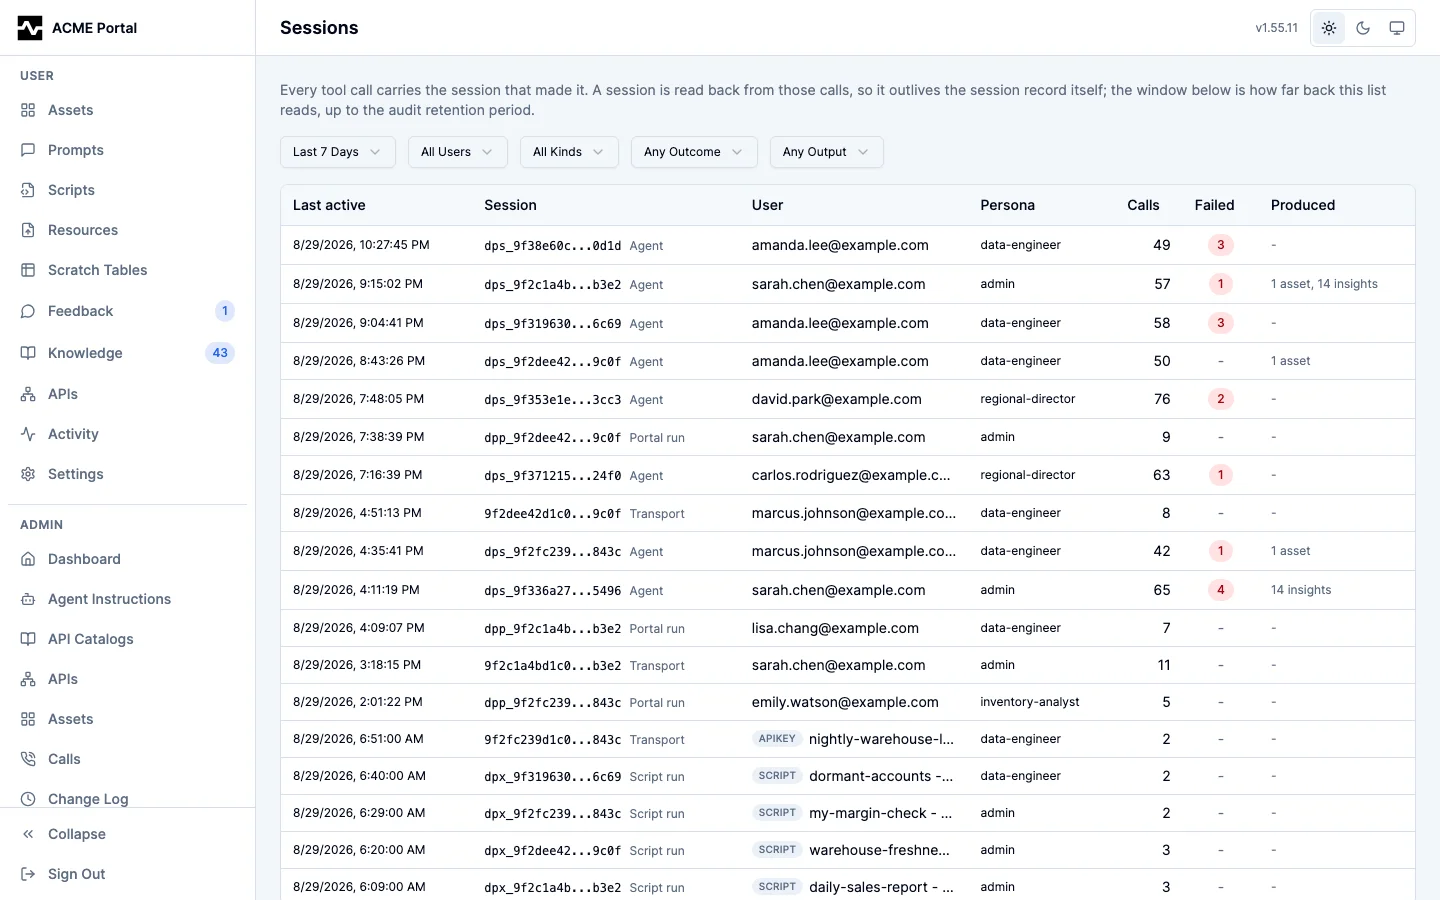
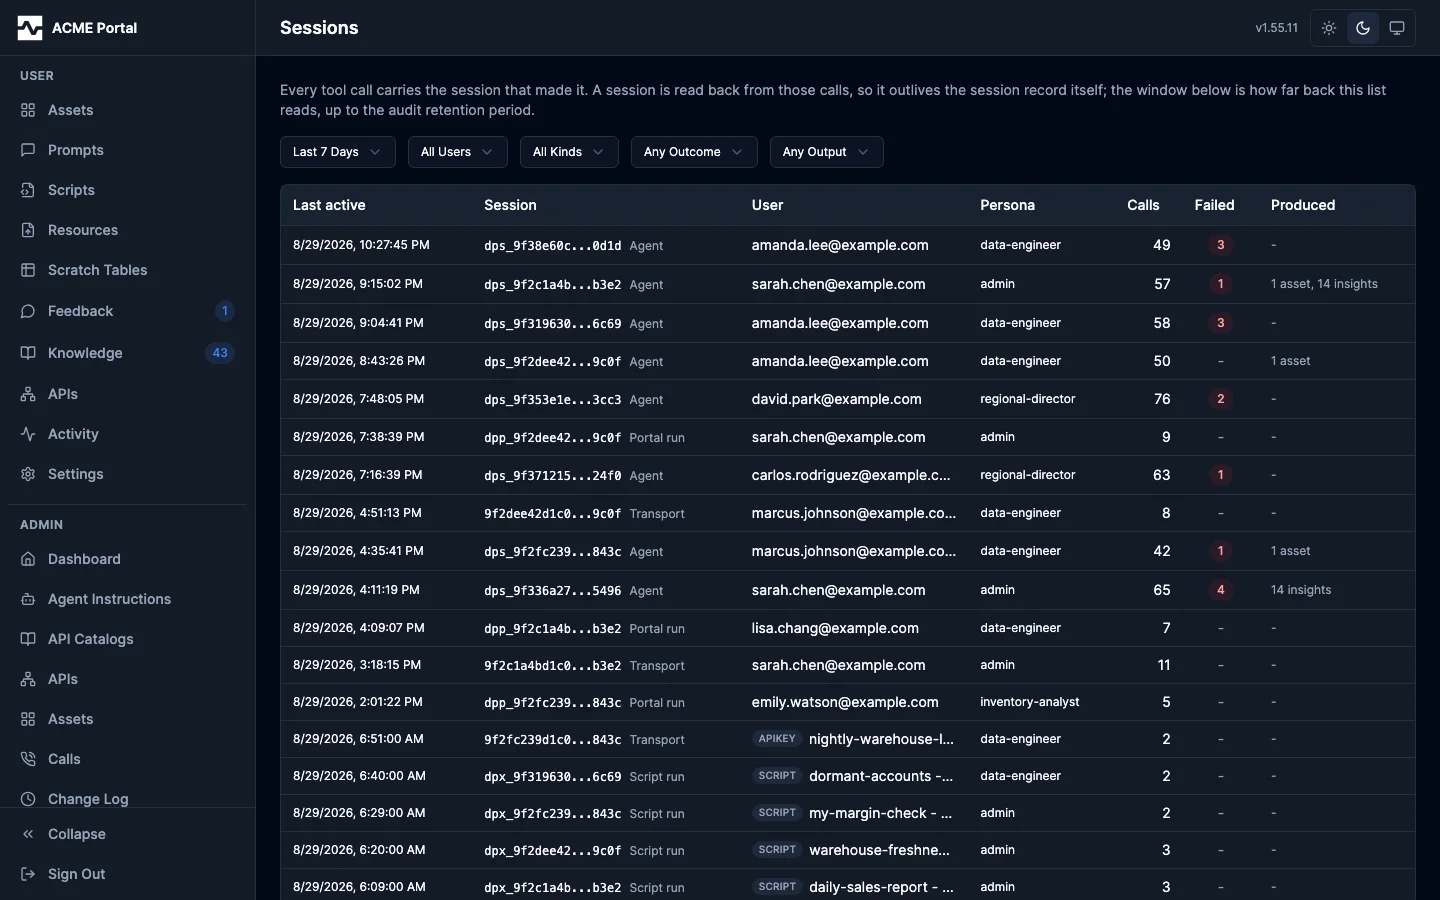
Every audit row carries the session_id of the call that wrote it. Grouped by that id, the log is a record of sessions: who was working, over what window, which tools and connections they reached, what failed, and what they left behind.
The platform's own session records cannot serve that purpose. They are working state with a TTL — the store deletes them on expiry (pkg/session/postgres) — so an hour after an agent stops, the row that represented its session is gone. The audit rows are still there, for as long as audit retention holds them. So a session here is derived, not stored: no new table, no second write path, and nothing to backfill.
A session id says where it came from, and the prefix is the only classification the platform has, since the ids of isolated runs are never persisted:
| Kind | Prefix | What it is |
|---|---|---|
agent |
dps_ |
A handle minted by platform_info and threaded by the agent across calls |
portal |
dpp_ |
One portal-driven tool run, isolated to a single request |
script |
dpx_ |
One managed-script run |
transport |
none | A transport-derived session, or a call recorded before explicit handles existed |
A session summary carries the caller and persona of its first event, its first and last call, its call and failure counts, the distinct tools and connections it touched, and how much it produced. Persona has one exception: while the live session record still exists, the persona the handle was minted under outranks the per-call persona, because that is what the session was authorized as.
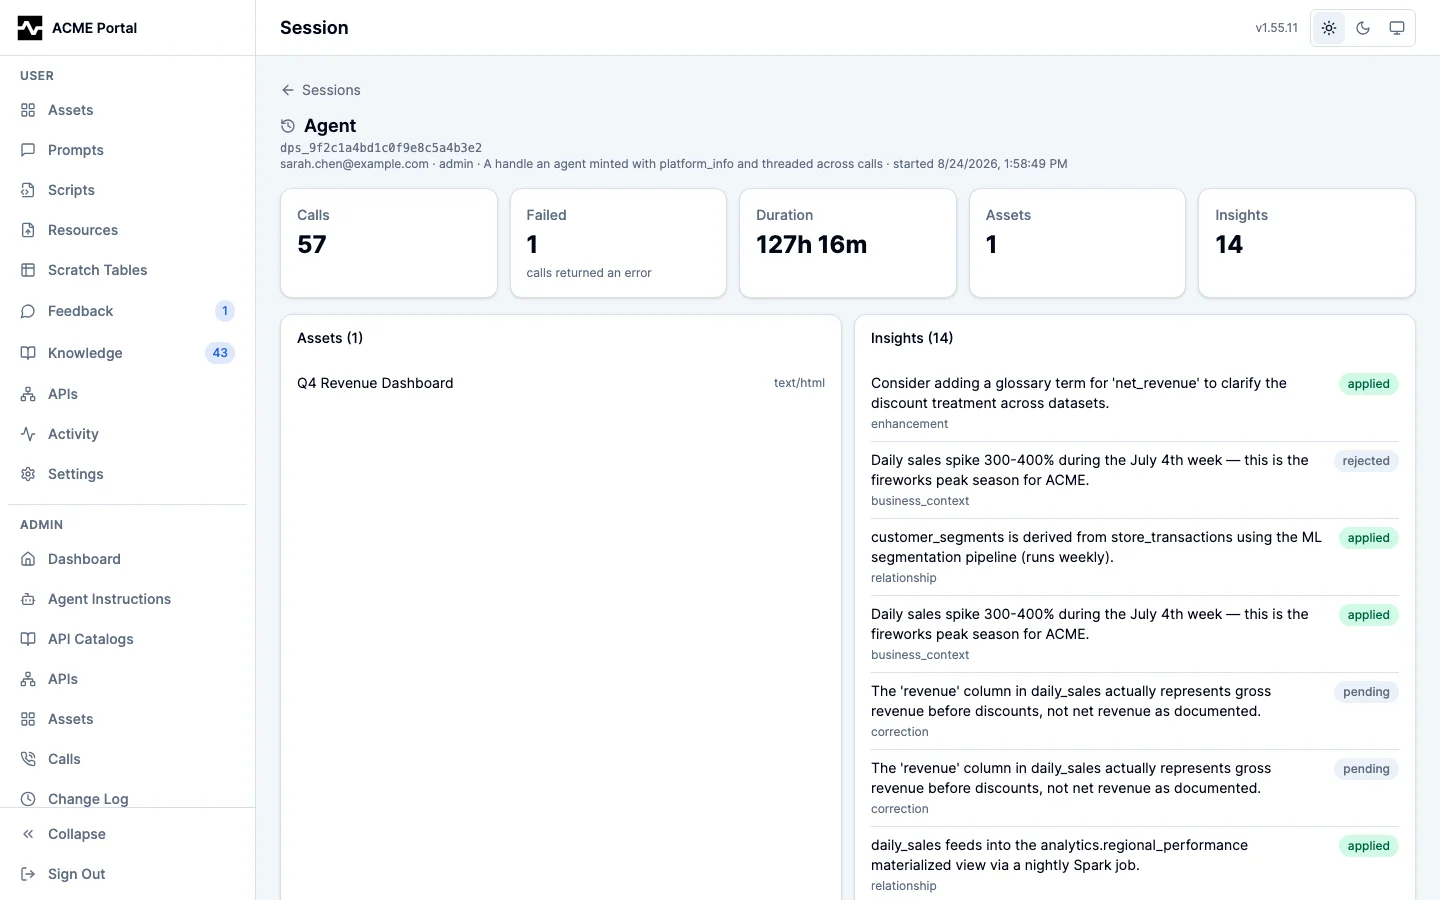
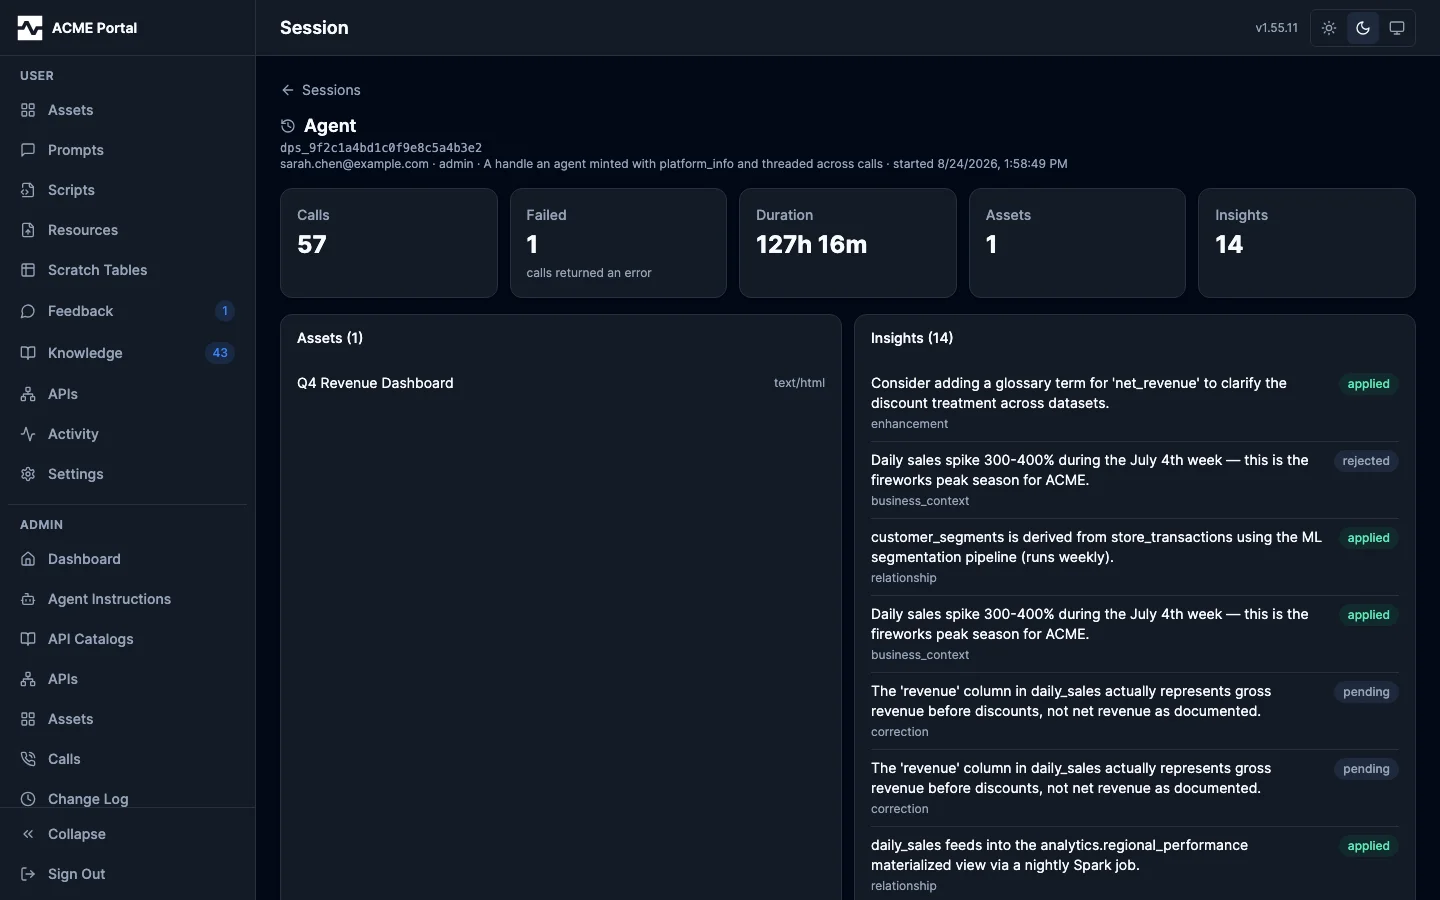
What a session produced is read from the two places the platform records it:
- Assets —
portal_assetsrows whosesession_idmatches, excluding deleted ones. - Insights — knowledge-dimension
memory_recordswhose metadata carries the capturing session. (Migration 000031 folded the oldknowledge_insightstable intomemory_records; an insight has been a memory record since.)
Opened, a session reads as its summary, those outputs, and the ordered record of its calls — each with the purpose the agent stated for it, the connection it reached, how it ended, and how long it took. That ordering is what the events list cannot give: the same rows sorted by time across every session tell you what happened on the platform, not what one person was doing.
Read it through the admin API:
GET /api/v1/admin/sessions?kind=agent&has_failures=true
GET /api/v1/admin/sessions/dps_9f2c1a4b8e7d6c5a4b3e2d1c0f9e8a7b
GET /api/v1/admin/audit/events?session_id=dps_9f2c1a4b8e7d6c5a4b3e2d1c0f9e8a7b
or in the portal under Admin > Sessions. See Session Endpoints for the full parameter and response reference and Sessions for the UI.
Two indexes support the joins (migration 000106): idx_portal_assets_session_id on live assets and idx_memory_records_session_id on the metadata expression. audit_logs was already indexed on session_id.
Who made the call
user_id names the principal, and the platform mints three kinds:
user_id |
Who it is |
|---|---|
| An OIDC subject (or OAuth token subject) | A person signed in |
apikey:<name> |
An API key, per pkg/auth |
script:<name> |
A managed-script run, per pkg/script's PrincipalPrefix |
A script runs under a principal of its own rather than borrowing its owner's, so a governed automation and the person who owns it are separable in every row. user_email carries the person the principal acts for, which keeps a run accountable but does not identify it: one owner's scripts all write that owner's address, as does the owner's own activity.
Read the two together. GET /api/v1/admin/audit/events/filters returns the distinct user_id values beside a user_labels map of user_id to user_email for exactly this reason, and the portal's user filter offers one option per principal, naming the script or key and the address it acts for.
Caller class via source
Tools on this platform are reachable through several entry points, all of which fire the same MCP audit middleware. The source field on each audit row records which path was used so operators can separate the populations without having to know which user IDs belong to which class of caller.
source |
What it means | Typical caller |
|---|---|---|
mcp |
Real MCP transport (stdio or HTTP/SSE) | Claude, other interactive MCP agents |
rest |
Gateway REST shim at POST /api/v1/gateway/{connection}/invoke |
Apache NiFi, cronjobs, integrations, anything HTTP that wraps the platform |
admin |
Admin REST API tool execution at POST /api/v1/admin/tools/call |
Portal UI "test this tool" buttons, ops scripts |
script |
A managed-script run's host bindings (middleware.SourceScript) |
run_script, a schedule, a draft run |
portal |
A portal action the platform audits directly rather than through a tool call | A script owner transfer, a DataHub write from the portal |
Both the gateway REST shim (internal/httpserver/gatewayhttp/handler.go) and the admin tool runner (pkg/admin/tools.go) open an in-memory MCP session against the assembled server and call the same api_invoke_endpoint (or other) tool that an agent would call. The handlers tag the context with middleware.WithSource before opening that session so the audit middleware records the originating caller class, not just "mcp".
For an admin-source run the tool-call middleware additionally mints a distinct portal session ID (dpp_ prefix) per request. A portal run drives a fresh in-memory session with no transport session ID, so without this it would record an empty session_id and its search-first gate, provenance, and dedup state would key on the operating admin's own user scope, letting a portal "test this tool" run pollute that operator's live agent session. The portal ID keeps portal runs attributable and isolated, and (like the gateway REST shim) they are exempt from the search-first and SESSION_REQUIRED gates, so a portal run of a query tool always executes.
Filter by source in the admin API:
GET /api/v1/admin/audit/events?source=mcp     # agents only
GET /api/v1/admin/audit/events?source=rest    # NiFi-class only
GET /api/v1/admin/audit/events?source=admin   # portal-driven only
Or in the portal UI, use the All Sources dropdown on the Audit Log page. The dropdown lists every source value seen in the current time window.
Event kind
The event_kind field separates the classes of audited activity that otherwise share the same row shape. These seven values are the complete set the column holds, and the set the admin API's event_kind filter accepts:
event_kind |
What it means |
|---|---|
mcp_tool_call |
A tool routed through one of the MCP toolkits (trino, datahub, s3, or the MCP gateway). |
apigateway_invoke |
An HTTP API call proxied through the apigateway toolkit (api_invoke_endpoint, api_export, and the other api_* tools). |
prompt_serve |
A database prompt served to an agent (prompts/get, or a resolved manage_prompt use). Carries prompt_id, prompt_name, and version in parameters, and is the source of the per-prompt run counts in the portal. |
resource_read |
A managed resource's content served. Carries resource_id, resource_uri, surface, and (when a specific revision was named) version in parameters. |
resource_move |
A managed resource refiled in another library. Carries resource_id, display_name, and the scope, scope id and URI on both sides of the move in parameters. |
script_run |
One execution of an approved managed script, written by the run worker when the run finishes. Carries script, script_id, version, run_id, owner, trigger, requested_by, and attempt in parameters, and carries the run id as its session_id so the run and the tool calls it made join on one key. |
admin |
An administrative act performed against somebody else's object. The one writer today is an administrator transferring a managed script to another owner, recorded whether the transfer succeeded or was refused. |
A tool call's kind is derived at write time from the toolkit kind, so the MCP/gateway split does not depend on tool-name string matching. A high-traffic API gateway can produce many rows per agent turn; the split lets the MCP Activity view exclude that traffic by default while a dedicated gateway view includes it. The other kinds are stamped by the surface that writes them.
Filter by event kind in the admin API. The filter is accepted on the event list, stats, and every metrics endpoint (timeseries, breakdown, overview, performance, enrichment, discovery):
GET /api/v1/admin/audit/events?event_kind=mcp_tool_call        # MCP tool calls only
GET /api/v1/admin/audit/events?event_kind=apigateway_invoke    # API gateway calls only
GET /api/v1/admin/audit/metrics/timeseries?event_kind=mcp_tool_call
GET /api/v1/admin/audit/events?event_kind=script_run           # scheduled and on-demand script runs
GET /api/v1/admin/audit/events/filters returns the kinds actually present in the current data, which is narrower than the table above on a deployment that has not used every surface. A filter naming a kind with no rows returns 200 with an empty result rather than an error.
Resource reads
A managed resource's content reaches a caller through four doors, and each writes one resource_read row naming which:
surface |
The door |
|---|---|
mcp_read |
An agent's MCP resources/read. |
fetch |
A search fetch of an mcp:resource:<id> reference. |
rest_download |
A content download from the portal or the REST API, including a download of a specific version. |
portal_preview |
The portal drawing an image tile in the resource library. Declared by the request (?preview=1 on the content route). |
Listing resources is deliberately not audited: only content actually served counts as a read, so the counts answer "is anything using this file" rather than "did this file appear in a list". A read that could not be served — a missing blob, a refused visibility check — writes nothing.
portal_preview is the one surface that does not stamp last_read_at. A resource has no stored thumbnail, so the library's image tiles are drawn from the resources' own bytes: a page view is a real read of every image in view, and counting those would clear the never-read flag and reorder the Recently read sort by browsing rather than by use. The read is still audited under the caller's own identity, because the bytes did reach them; a client is naming why it is reading, not choosing whether it is recorded.
These rows are what the portal's resource usage panel aggregates into 30- and 90-day read counts per surface, so the counts inherit the retention window configured below and a resource shown as a tile carries a portal_preview count that is separate from the rest. The resource's own last_read_at column is stamped alongside the audit row for every other surface and outlives retention, which is what the admin table's Recently read sort orders on. With audit.enabled: false no rows are written, no usage is shown, and reads are served exactly as before.
Resource moves
A managed resource can be refiled after it is uploaded — in another library, in another folder of the one it is in, or both (Moving a resource to another library). Each move writes one resource_move row under tool_name = resource_move, carrying the resource's id and display name and where it was filed on each side: from_scope, from_scope_id, from_path, from_uri, to_scope, to_scope_id, to_path, to_uri. Renaming a folder writes one such row per resource it carried, because the question the trail answers is what address a given file has now.
Both sides are on the row because two different questions are asked of it. "Who put this file in front of the whole platform" is answered by the destination; "what address did this file used to have" is answered by the origin, and that is what an operator needs when a knowledge page or a script body cites a URI the resource no longer holds. Refiling a resource to the library it is already in writes nothing: a move that changed nothing would read as somebody having refiled the file.
With audit.enabled: false no rows are written and moves are performed exactly as before.
Parameter Sanitization
Tool call arguments are logged for debugging and compliance. The parameters field stores those arguments verbatim (including complete SQL text and anything embedded in it), so treat it as sensitive.
One bound applies before anything else: an argument value larger than 16KB is stored as [TRUNCATED: <n> bytes] rather than its content. An audit row records what was called, not what was carried — some tools take a payload as an argument (an object body written to storage, a file uploaded, a report a managed script delivers on every scheduled fire), and storing those verbatim would put a second copy of that data in the audit table. A query, a prompt, or a path is far inside the bound and is recorded whole.
A built-in baseline replaces the values of these well-known keys with [REDACTED] before storage:
passwordsecrettokenapi_keyauthorizationcredentials
This baseline matching is case-sensitive and exact. A parameter named user_password would not be caught by it (only password is matched). It is a safety net, not a substitute for configuring your own sensitive argument names.
For your own keys, set audit.redact_keys, a case-insensitive list of top-level argument keys whose values are masked in the middleware, before the event ever leaves the request path. Nested keys are not matched (top-level only, by design). For tools whose inputs cannot be made safe to retain even with redaction, set audit.log_parameters: false to drop the arguments entirely. A result key a tool reports about the call's outcome is not an argument value and is recorded either way; with arguments dropped it is all parameters holds.
Delivery semantics
audit.delivery selects how an event travels from the middleware to the store; either mode captures the same fields.
async(default). Events are enqueued on a bounded in-memory writer and persisted by a single background goroutine, so a tool call is never blocked by store latency. This is best-effort: under a sustained store outage or a crash, queued events are dropped rather than retained. Every lost event increments theaudit_events_dropped_totalmetric, which also covers writes that fail or exceed the per-write timeout.-
sync. Each event is written on the request goroutine with a per-write timeout (5s), so a slow store applies backpressure to the tool call (it waits) rather than shedding events: there are no queue-overflow drops. Choose this when a compliance posture requires durability over latency. A store write that still fails or times out is logged and counted (audit_events_dropped_total) but, as in async mode, never fails the tool call: audit must not break tools.Two operational consequences to weigh before enabling
sync:- Latency under a stalled store. When the database is slow or unreachable, every tool call blocks for up to the 5s per-write timeout before its handler returns to the client. The async writer never adds this latency (it enqueues and returns).
- Shared connection pool. Sync writes draw a connection from the same pool used for OAuth, sessions, portal, and connection queries. Under concurrent load against a stalled store, in-flight audit writes hold connections for the timeout window and can contend with those other subsystems. The single-goroutine async writer structurally caps audit at one concurrent connection and cannot cause this. A graceful shutdown cancels in-flight sync writes so teardown is not held for the full timeout. Size
databasepool limits with sync audit in mind, or keep the defaultasyncmode.
Database Schema
The audit_logs table is partitioned by created_date for efficient retention management:
CREATE TABLE audit_logs (
    id              VARCHAR(32) NOT NULL,
    timestamp       TIMESTAMPTZ NOT NULL DEFAULT NOW(),
    duration_ms     INTEGER,
    request_id      VARCHAR(255),
    user_id         VARCHAR(255),
    user_email      VARCHAR(255),
    persona         VARCHAR(100),
    tool_name       VARCHAR(255) NOT NULL,
    toolkit_kind    VARCHAR(100),
    toolkit_name    VARCHAR(100),
    connection      VARCHAR(100),
    purpose         TEXT,
    parameters      JSONB,
    success         BOOLEAN NOT NULL,
    error_message   TEXT,
    created_date    DATE NOT NULL DEFAULT CURRENT_DATE,
    PRIMARY KEY (id, created_date)
) PARTITION BY RANGE (created_date);
Indexes
| Index | Column | Use Case |
|---|---|---|
idx_audit_logs_timestamp |
timestamp |
Time-range queries |
idx_audit_logs_user_id |
user_id |
Per-user audit trails |
idx_audit_logs_tool_name |
tool_name |
Tool usage analytics |
idx_audit_logs_success |
success |
Failure investigation |
idx_audit_logs_created_date |
created_date |
Partition pruning, retention cleanup |
Querying Audit Logs
Recent tool calls by user
SELECT timestamp, tool_name, toolkit_kind, success, duration_ms
FROM audit_logs
WHERE user_id = '[email protected]'
ORDER BY timestamp DESC
LIMIT 20;
Failed calls in the last 24 hours
SELECT timestamp, user_id, tool_name, error_message, duration_ms
FROM audit_logs
WHERE success = false
  AND timestamp > NOW() - INTERVAL '24 hours'
ORDER BY timestamp DESC;
Tool usage by toolkit
SELECT toolkit_kind, tool_name, COUNT(*) as calls,
       AVG(duration_ms) as avg_ms, SUM(CASE WHEN success THEN 0 ELSE 1 END) as failures
FROM audit_logs
WHERE timestamp > NOW() - INTERVAL '7 days'
GROUP BY toolkit_kind, tool_name
ORDER BY calls DESC;
Persona activity
SELECT persona, COUNT(*) as calls, COUNT(DISTINCT user_id) as users
FROM audit_logs
WHERE timestamp > NOW() - INTERVAL '30 days'
GROUP BY persona
ORDER BY calls DESC;
Slow queries (> 5 seconds)
SELECT timestamp, user_id, tool_name, duration_ms,
       parameters->>'sql' as query
FROM audit_logs
WHERE duration_ms > 5000
  AND toolkit_kind = 'trino'
ORDER BY duration_ms DESC
LIMIT 10;
Enrichment token savings
SELECT enrichment_mode,
       COUNT(*) AS calls,
       SUM(enrichment_tokens_full) AS tokens_full,
       SUM(enrichment_tokens_dedup) AS tokens_dedup,
       SUM(enrichment_tokens_full) - SUM(enrichment_tokens_dedup) AS tokens_saved
FROM audit_logs
WHERE enrichment_applied = true
  AND timestamp > NOW() - INTERVAL '7 days'
GROUP BY enrichment_mode
ORDER BY calls DESC;
Discovery-before-query patterns
WITH session_tools AS (
    SELECT session_id, toolkit_kind,
           MIN(timestamp) AS first_call
    FROM audit_logs
    WHERE timestamp > NOW() - INTERVAL '7 days'
    GROUP BY session_id, toolkit_kind
),
session_patterns AS (
    SELECT session_id,
           BOOL_OR(toolkit_kind = 'datahub') AS has_discovery,
           BOOL_OR(toolkit_kind = 'trino') AS has_query,
           MIN(CASE WHEN toolkit_kind = 'datahub' THEN first_call END) AS first_discovery,
           MIN(CASE WHEN toolkit_kind = 'trino' THEN first_call END) AS first_query
    FROM session_tools
    GROUP BY session_id
)
SELECT
    COUNT(*) AS total_sessions,
    COUNT(*) FILTER (WHERE has_discovery AND has_query AND first_discovery < first_query) AS discovery_first,
    COUNT(*) FILTER (WHERE has_query AND NOT has_discovery) AS query_without_discovery
FROM session_patterns;
Retention, partition rotation, and cleanup
A background maintenance routine runs every 24 hours and performs three steps in order:
- Ensure upcoming partitions. Create named monthly partitions for the next two months (
audit_logs_YYYY_MM). The current month is intentionally skipped on brownfield deployments so existing rows inaudit_logs_defaultdo not conflict with a new named partition over the same date range. This step is idempotent (CREATE TABLE IF NOT EXISTS). - Delete expired rows. Remove rows where
timestamp < NOW() - INTERVAL '<retention_days> days'. PostgreSQL prunes the DELETE to only the partitions that overlap the retention window. - Drop fully-expired partitions. Drop any
audit_logs_YYYY_MMwhose entire date range ends at or before the retention cutoff.DROP TABLEon a partition is effectively constant time and reclaims storage immediately, unlike row-level DELETE.
-- step 1 (illustrative)
CREATE TABLE IF NOT EXISTS audit_logs_2026_06 PARTITION OF audit_logs
    FOR VALUES FROM ('2026-06-01') TO ('2026-07-01');

-- step 2
DELETE FROM audit_logs WHERE timestamp < NOW() - INTERVAL '90 days';

-- step 3 (illustrative, when audit_logs_2025_12 is fully past retention)
DROP TABLE IF EXISTS audit_logs_2025_12;
The maintenance routine starts automatically when the audit store is initialized. The eager pre-tick partition creation also runs once at startup so rows written between startup and the first tick land in a named partition when their month is covered.
Failures in any one step are logged and isolated: a transient failure to create a partition does not skip the retention DELETE on the same tick.
Multi-replica safety
Every replica runs its own 24h ticker, but the maintenance work itself is guarded by a PostgreSQL advisory lock (pg_try_advisory_lock). Each tick:
- Each pod opens a dedicated connection and calls
pg_try_advisory_lockon a stable lock key. - Exactly one pod acquires the lock; the rest get
falseback and exit silently to wait for the next tick. - The winning pod runs ensure → DELETE → drop, then
pg_advisory_unlocks.
This means the DELETE scan, partition CREATE, and partition DROP each run exactly once per tick across the cluster, regardless of replica count. The advisory lock is session-scoped to the dedicated connection so it cannot leak across pods, and IF NOT EXISTS / IF EXISTS on CREATE/DROP means even a degenerate dual-acquire (which the lock prevents) would still be idempotent.
For deployments running at high volume (the canonical motivating case is Apache NiFi calling the gateway REST shim at order-of-magnitude-per-second), monthly partition rotation keeps the working DELETE bounded to recent partitions and lets old data be bulk-dropped as whole partitions rather than scanned row-by-row.
How It Works
Audit logging is implemented as MCP protocol-level middleware. The middleware chain execution order is:
- MCPToolCallMiddleware (outermost) authenticates the user, resolves the persona, looks up toolkit metadata, and stores everything in a
PlatformContexton the request context. - MCPAuditMiddleware (inner to auth) receives the context with
PlatformContextalready set. It records the start time, calls the next handler, measures duration, then reads all fields fromPlatformContextto build the audit event. - The audit event is handed to the writer selected by
audit.delivery(see Delivery semantics). In the defaultasyncmode it is placed on a bounded in-memory queue that a single background goroutine drains, so the tool response is never blocked by store latency; a graceful shutdown drains that queue (bounded by a 10s deadline) before the store and database are closed. Insyncmode it is written on the request goroutine. In either mode a failed store write is logged viaslog.Errorand counted inaudit_events_dropped_total, and the tool call still succeeds.
Unauthorized requests are rejected by MCPToolCallMiddleware before reaching the audit middleware, so they are not logged. Only authenticated, authorized tool calls appear in audit logs.
Troubleshooting
No audit logs appearing
- Verify both
audit.enabled: trueANDaudit.log_tool_calls: trueare set in your config. - Verify
database.dsnis configured and the database is reachable. - Check platform startup logs for
"audit logging enabled". If you see"using noop logger", the database connection failed. - Check for
slog.Errormessages containing"failed to log audit event", which indicate database write failures.
Audit logs have empty fields
If user_id or other identity fields are empty, check your authentication configuration. API key authentication populates user_id with the key name. OIDC populates it from the sub claim.
If toolkit_kind, toolkit_name, or connection are empty, the tool was not found in any registered toolkit's tool list. This can happen with platform-level tools like platform_info that are not part of a toolkit.